Implementation of Emergency Remote Teaching in Chilean Schools due to COVID-19
Faculty of Communication and Arts, Universidad de Las Americas, Chile.
Abstract
This research emerged from the need to understand educators’ working and teaching conditions during the initial period of distance teaching implementation brought about by the need to continue education in the face of the public health emergency and the suspension of on-site classes in Chilean schools. Thus, the aim of this investigation is to explore Chilean teachers’ perceptions in relation to Emergency Remote Teaching (ERT) within the COVID-19 context. The methodology includes a dynamic online questionnaire to allow a large number of educators to be included in the study. Some of the findings include the substantial curricular adaptation made by teachers, the use of teachers’ own resources to contact students, the overall low level of satisfaction with remote teaching, as well as the increased working hours, and the different connectivity conditions and levels of student participation depending on the socio-economic profile of the school. The conclusions of this research are discussed from the perspective of the hypotheses presented in this study.
Keywords:Remote teaching, Chilean schools, Online education, Teachers’ perception, Teaching conditions, Emergency remote teaching, Curricular adaptation, Covid-19, Educational contingency.
Contribution of this paper to the literature:This study investigates the conditions during the implementation of Emergency Remote Teaching (ERT) in the Chilean school system. It is distinguished from previous studies because it takes into account teachers’ and students’ connectivity conditions to understand the teaching-learning process. Also, it provides meaningful insight into teachers’ technical knowledge and personal preparation, as well as their level of satisfaction with ERT and their performance in this once unexpected and unknown scenario.
1. Introduction
The year 2020 started with a threat to world public health that would also affect the Chilean education system: COVID-19, an illness which is caused by the SARS-CoV-2 virus, and which, according to Pérez, Gómez, and Dieguez (2020![]() ), particularly affects people with respiratory problems and weak immune systems, and senior citizens.
), particularly affects people with respiratory problems and weak immune systems, and senior citizens.
The virus originated in China and rapidly spread across the world. According to the BBC, at the beginning of the pandemic there were around 20,000 recorded cases in Latin America, a number which rose drastically in less than a month, reaching 168,000 cases during the first week of April. This situation posed a health risk on a continental level and represented problem for the workforce and public life overall due to the rise of containment measures for the virus, such as quarantines, closure of public spaces and the mandatory use of face masks. Peru, Chile, Ecuador, and Brazil were the most affected countries within Latin America during the first months.
Nevertheless, schools in Chile started their regular classes at the end of February 2020, having adopted a few protocols to avoid the spread of the virus within the community. The situation drastically changed, however, during the first week of March, when the Education Ministry officially canceled on-site classes; yet, schools were asked not to interrupt the learning process. These measures were taken 15 days after the first recorded case of COVID-19 in Chile and required educational institutions to create working arrangements that could accomplish said mandate, which meant that teachers had to adjust quickly to the Emergency Remote Teaching (ERT) system.
This paper provides a perspective on the conditions that the teachers within the Chilean education system faced during the ERT implementation period. This includes issues surrounding the general connectivity of their students and the technical and professional preparation of teachers in distance learning. It also provides a new outlook on the experiences and level of satisfaction of Chilean teachers in relation to their performance in this new and unexpected scenario.
The overall objective of this study was to gain an understanding of Chilean teachers’ perceptions of emergency remote teaching within the COVID-19 context. Three main goals were developed to achieve this objective: 1) identify the conditions that enabled teachers in different settings to work in distance learning; 2) characterize the teachers’ perceptions regarding the support given by academic and governmental authorities, and 3) evaluate teachers’ satisfaction level with respect to their own expectations and performance in teaching and assessing during this process.
The general hypothesis is that teachers within the Chilean education system are not satisfied with the conditions of remote learning.
Aligned with this, the study is expected to prove the following assertions:
- The connectivity of teachers and students is strongly affected by geographical distribution.
- The students’ connectivity is affected by the socioeconomic status of their family.
- Educators do not have the proper training, nor the capacity to deal with the job of teaching remotely.
- Educators feel supported by the school administration regarding the measures taken, but not necessarily by the local and national government.
- Teachers that belong to the “Millennial” and “Z” generations, who are under 40 years old, feel more satisfied with their performance during remote teaching, as well as with the effectiveness of their instruction in this context, in comparison to teachers belonging to earlier generations.
2. Theoretical Framework
According to Simonson, Zvacek, and Smaldino (2019![]() ), remote teaching dates back to the 1830s, when it was known as correspondence education. As the name implies, this meant learning via assignments mailed to a tutor. This modality rapidly spread across the world, and prestigious universities began to offer similar courses. Then, eventually, came learning through television, which offered the opportunity for governments to educate people at home, especially in remote areas; this was also broadly followed in university programs (FNU, 2019
), remote teaching dates back to the 1830s, when it was known as correspondence education. As the name implies, this meant learning via assignments mailed to a tutor. This modality rapidly spread across the world, and prestigious universities began to offer similar courses. Then, eventually, came learning through television, which offered the opportunity for governments to educate people at home, especially in remote areas; this was also broadly followed in university programs (FNU, 2019![]() ). Over time, this methodology evolved into what today is known as online distance learning, which implies the use of different learning management system (LMS) platforms to offer synchronous and asynchronous instruction.
). Over time, this methodology evolved into what today is known as online distance learning, which implies the use of different learning management system (LMS) platforms to offer synchronous and asynchronous instruction.
Nevertheless, it is important to note that the current situation does not strictly match the definition of distance education, but rather what might be called Emergency Remote Teaching (ERT), which is characterized as being a rapid response to the current worldwide crisis. In this sense, Hodges, Moore, Lockee, Trust, and Bond (2020![]() ) point out that, generally, key components of online learning programs are their thorough conception and planning: it takes months of work to develop an instructional program that can generate learning results. Consequently, it is also understood by both the teacher and the students that the instruction will be conducted online. In contrast, a key element of ERT is that it implies “totally remote teaching solutions for the instruction or education that, in an alternative way would be on-site or as a mixed or hybrid course and that will go back to this format once the crisis or emergency has minimized” (Hodges et al., 2020
) point out that, generally, key components of online learning programs are their thorough conception and planning: it takes months of work to develop an instructional program that can generate learning results. Consequently, it is also understood by both the teacher and the students that the instruction will be conducted online. In contrast, a key element of ERT is that it implies “totally remote teaching solutions for the instruction or education that, in an alternative way would be on-site or as a mixed or hybrid course and that will go back to this format once the crisis or emergency has minimized” (Hodges et al., 2020![]() ). In addition, the authors remark that it is not only a solid curriculum that promotes learning, but also the support and infrastructure that surrounds the learning process during on-site instruction. This raises the question whether teachers have the technical and pedagogical experience needed to create and implement an ERT process that has been sufficiently skillfully developed to captivate the students and boost online learning.
). In addition, the authors remark that it is not only a solid curriculum that promotes learning, but also the support and infrastructure that surrounds the learning process during on-site instruction. This raises the question whether teachers have the technical and pedagogical experience needed to create and implement an ERT process that has been sufficiently skillfully developed to captivate the students and boost online learning.
Along these same lines, Portillo, Pierra, González, and Nogales (2020![]() ) point out that one of the problems during ERT is that curricula are generally created in a standardized manner without always considering the specific needs that students might have. Further, considering that the instruction is received through devices that require connection to the Internet (Bustamante, 2020
) point out that one of the problems during ERT is that curricula are generally created in a standardized manner without always considering the specific needs that students might have. Further, considering that the instruction is received through devices that require connection to the Internet (Bustamante, 2020![]() ), a disparity is created for those who have limited material and economic resources and those who are subject to different geographic situations (Portillo et al., 2020
), a disparity is created for those who have limited material and economic resources and those who are subject to different geographic situations (Portillo et al., 2020![]() ).
).
In the specific Chilean context, the education policy states that all children and teenagers under the age of 18 must be registered in the Chilean education system. There are approximately sixteen thousand educational institutions that offer on-site teaching, from preschool to high school, with students from approximately 4 to 18 years old (Ministry of Education Study Center Statistics Unit, 2018![]() ). This number of institutions includes only those accepted by the Chilean Ministry of Education (Ministerio de Educación de Chile, MINEDUC); homeschooling and non-recognized institutions are not included in this count. Another important aspect is that, according to MINEDUC’s 2018 annual report, 95% of schools belong to the public or subsidized sector, whereas 5% are private schools. Furthermore, considering the geographical distribution of schools, 60% of schools are located in urban areas, whilst the rest are located in rural areas. Yet despite this, as of the 2018 annual report, fewer than five private schools were registered in rural areas of the country (Ministry of Education Study Center Statistics Unit, 2018
). This number of institutions includes only those accepted by the Chilean Ministry of Education (Ministerio de Educación de Chile, MINEDUC); homeschooling and non-recognized institutions are not included in this count. Another important aspect is that, according to MINEDUC’s 2018 annual report, 95% of schools belong to the public or subsidized sector, whereas 5% are private schools. Furthermore, considering the geographical distribution of schools, 60% of schools are located in urban areas, whilst the rest are located in rural areas. Yet despite this, as of the 2018 annual report, fewer than five private schools were registered in rural areas of the country (Ministry of Education Study Center Statistics Unit, 2018![]() ).
).
The characterization of the socioeconomic groups that these institutions cater to is another factor within the education system. For the purposes of this study, the institutions were classified in the following categories: High, Upper-middle, Middle, Lower-middle, and Low, which were developed by the National Board of School Aid and Scholarships (commonly known by the Spanish acronym JUNAEB). In this regard, the Agency for the Quality of Education (2012![]() ) defined each segment according to the number of years of school completed and household income in the following manner:
) defined each segment according to the number of years of school completed and household income in the following manner:
- High group: the household income starts from $1.250.001 CLP, and most guardians have 16 or more years of education.
- Upper-middle group: the household income ranges from $550.001 to $1.250.000 CLP, and most guardians have between 13 and 15 years of education.
- Middle group: the household income ranges from $340.001 to $550.000 CLP, and most guardians have 11 or 12 years of education.
- Lower-middle group: the household income ranges from $220.001 to $340.000 CLP, and most guardians have 9 or 10 years of education.
- Low group: the household income is $220.000 or lower, and most guardians have up to 8 years of education.
The above figures become relevant when considering the access to and quality of Internet connections in rural areas, as well as the different facilities that students and teachers have access to that not only help with learning but also with teaching. With regards to connectivity, the Ministry of Telecommunications (2017![]() ) indicated that, as of 2017, 43.9% of homes had neither a wired nor wireless Internet connection, meaning that the only available connection was via mobile data. A significant 12.6% of households had no access to the Internet whatsoever. The report also establishes that the most common reason for the lack of Internet connection was the high price of the service, followed by a lack of interest in and knowledge of how to use smartphones and computers.
) indicated that, as of 2017, 43.9% of homes had neither a wired nor wireless Internet connection, meaning that the only available connection was via mobile data. A significant 12.6% of households had no access to the Internet whatsoever. The report also establishes that the most common reason for the lack of Internet connection was the high price of the service, followed by a lack of interest in and knowledge of how to use smartphones and computers.
The OECD (2019![]() ) noted that access to the Internet has risen to 87.5% in Chile, which is higher than the average of the countries within the organization. Nevertheless, an inequality in Internet use is apparent, since most Chileans only use it for no more than one activity. When it comes to the use of the Internet, Education and Digital Skills are the areas in which the country most lags behind. This results in students having a low level of online interaction when taking part in learning and other activities. Additionally, there is a significant gap when it comes to problem-solving skills. All these areas are essential when faced with teaching and learning during this pandemic and ensuring continuity of the learning process with the least possible amount of interruption.
) noted that access to the Internet has risen to 87.5% in Chile, which is higher than the average of the countries within the organization. Nevertheless, an inequality in Internet use is apparent, since most Chileans only use it for no more than one activity. When it comes to the use of the Internet, Education and Digital Skills are the areas in which the country most lags behind. This results in students having a low level of online interaction when taking part in learning and other activities. Additionally, there is a significant gap when it comes to problem-solving skills. All these areas are essential when faced with teaching and learning during this pandemic and ensuring continuity of the learning process with the least possible amount of interruption.
In this respect, in answer to the health crisis, the Ministry of Education requested that schools not interrupt the learning process of students across the country; in other words, “school is not suspended, but rather, its functioning is fundamental, even in these circumstances” (Steiervalt & Salinas, 2020![]() ). To accomplish this, different protocols were published consisting of guidelines on how to keep working on the students’ learning. One of these protocols instructed those schools in which families and the wider community had Internet access to keep functioning during the semester through online platforms, whilst schools in rural areas or without access to the Internet were required to work with printed material, which was sent to schools where families could collect it (Ministry of Education, 2020
). To accomplish this, different protocols were published consisting of guidelines on how to keep working on the students’ learning. One of these protocols instructed those schools in which families and the wider community had Internet access to keep functioning during the semester through online platforms, whilst schools in rural areas or without access to the Internet were required to work with printed material, which was sent to schools where families could collect it (Ministry of Education, 2020![]() ). Accordingly, Appendix 13, published in June 2020, provides an orientation to the implementation of the curricular prioritization, both in the remote and on-site modalities, in case on-site classes started again. In addition, the Ministry of Education (2020
). Accordingly, Appendix 13, published in June 2020, provides an orientation to the implementation of the curricular prioritization, both in the remote and on-site modalities, in case on-site classes started again. In addition, the Ministry of Education (2020![]() ) categorized the learning objectives and content into three levels of importance, to consider the priority with which each could be covered during the academic year. As part of the ministerial initiatives, various resources were provided for teachers and students, such as the G-Suite platform, learning online platform, TV Learning, Digital School Library, plans to deliver printed resources, Learning FM, school texts, and online conferences for school faculty members.
) categorized the learning objectives and content into three levels of importance, to consider the priority with which each could be covered during the academic year. As part of the ministerial initiatives, various resources were provided for teachers and students, such as the G-Suite platform, learning online platform, TV Learning, Digital School Library, plans to deliver printed resources, Learning FM, school texts, and online conferences for school faculty members.
The crucial role of teachers in facing this challenge is also outlined in these documents, however they fail to describe the preparation or the necessary knowledge and skills to establish a virtual learning environment, nor how teachers can gain said skills through any official initiative. In this regard, Gros and Silva (2005![]() ) establish that the teacher’s role is essential to promote learning in a virtual environment, but also indicate that achieving good results in an on-site institution does not ensure success online. Moreover, they argue that every teacher working in remote instruction should be properly trained in four main dimensions: Social, Pedagogical, Technical, and Administrative. These can be acquired through online courses or even through self-study, although the first two dimensions have a lot to do with personal perceptions and teaching experience in both regular and remote environments.
) establish that the teacher’s role is essential to promote learning in a virtual environment, but also indicate that achieving good results in an on-site institution does not ensure success online. Moreover, they argue that every teacher working in remote instruction should be properly trained in four main dimensions: Social, Pedagogical, Technical, and Administrative. These can be acquired through online courses or even through self-study, although the first two dimensions have a lot to do with personal perceptions and teaching experience in both regular and remote environments.
Adopting a similar perspective, Silva et al. (2019![]() ) discovered that 64% of Chilean teachers design activities that involve the use of technology, and 63% assert that they use software to carry out learning activities. Conversely, only 45% mention using technology in their classroom activities, and only 41% use different applications to organize content and access information. The same study found, with regards to the gender of the participants, that women scored highest in methodology and teaching strategy, while men scored highest in ethical and legal aspects. When Education 2020 (2020
) discovered that 64% of Chilean teachers design activities that involve the use of technology, and 63% assert that they use software to carry out learning activities. Conversely, only 45% mention using technology in their classroom activities, and only 41% use different applications to organize content and access information. The same study found, with regards to the gender of the participants, that women scored highest in methodology and teaching strategy, while men scored highest in ethical and legal aspects. When Education 2020 (2020![]() ) asked Chilean educators how they felt about their digital skills, over 70% of the participants said they felt “reasonably capable” or “highly capable”, and one out of every five teachers felt “completely capable”. However, it is important to note that this perception refers to their digital competence in relation to computer use and online navigation, which does not necessarily imply that their performance is efficient when it comes to designing learning activities or assessments in online settings.
) asked Chilean educators how they felt about their digital skills, over 70% of the participants said they felt “reasonably capable” or “highly capable”, and one out of every five teachers felt “completely capable”. However, it is important to note that this perception refers to their digital competence in relation to computer use and online navigation, which does not necessarily imply that their performance is efficient when it comes to designing learning activities or assessments in online settings.
In response to the new educational reality, UNESCO has created an informative guide for teachers, called “Teaching in the times of Covid-19”, in which they reconsider education and suggest platforms for distance teaching. The document also lists useful practices in online instruction, such as the estimated time that should be used for teaching each week, in addition to evaluation instruments, such as learning journals, portfolios, self-assessments, and observation sheets.
The Chilean experience has been studied from different perspectives; one of these corresponds to the survey “Teaching during the health crisis: the teachers’ point of view” (2020) which was conducted by research groups from different Chilean universities. It showed that 49% of respondents felt that the students were learning during the period, versus 51% that indicated otherwise. In addition, 62% claimed to have frequent contact with their students, and 42% said they conducted pedagogical exchange during this period (Hinostroza et al., 2020![]() ).
).
Additionally, the international initiative, Tu Clase Tu País (2020![]() ) conducted a similar study, which indicated that 45% of the surveyed teachers worked between four and eight hours daily, and 44% worked more than eight hours per day. They also noted that 26% conducted videoconference classes, 25% used learning platforms and 20% provided worksheets and supplies at the school. Moreover, just under half indicated that the minority of their students had the necessary equipment to take an online class. Finally, nearly 95% of the participants felt that the students were learning less than in a regular school year, and that it was not possible to conduct effective assignments and assessment during this period (Tu Clase Tu País, 2020
) conducted a similar study, which indicated that 45% of the surveyed teachers worked between four and eight hours daily, and 44% worked more than eight hours per day. They also noted that 26% conducted videoconference classes, 25% used learning platforms and 20% provided worksheets and supplies at the school. Moreover, just under half indicated that the minority of their students had the necessary equipment to take an online class. Finally, nearly 95% of the participants felt that the students were learning less than in a regular school year, and that it was not possible to conduct effective assignments and assessment during this period (Tu Clase Tu País, 2020![]() ).
).
3.Methodology
The methodology applied in this research is a selection of non-probabilistic samples in which the participants were volunteers that agreed to be a part of an anonymous survey, which consisted mostly of multiple-choice questions related to the objectives of the study.
3.1. Instrument
To collect the data, a dynamic survey was carried out which consisted of up to 54 multiple-choice questions that were adapted according to the answers given in each section. The survey consisted of various sections that had the aim of collecting data of the participants’ demographics and the institutions where they work, variables concerning Internet access, communication with students, the type and number of implemented activities, support measures for the teachers’ performance from the institutions, support and government measures, participants’ satisfaction level regarding their own performance, and the level of effectiveness of remote instruction.
This instrument allows a larger number of participants to be reached, which translates into a broader representation of teachers, in comparison with other data collection methods that can only be distributed to a smaller sample. In addition, the circumstances prohibited in-person surveys to be conducted, and the online methodology allowed the inclusion of teachers from different locations and educational levels around the country, which involved more participants in the study.
The objectives and hypothesis guided the design of the different variables and questions that formed part of the survey. Once this stage was finished, the survey underwent validation by three experts related to the educational and research area and was modified according to their observations. Once the necessary revisions and adjustments had been made, the survey was created on Google Forms and was tested by 20 volunteers from different educational and work backgrounds to create a varied picture of the questions and online functionality for final calibration.
3.2. Description of Participants
The calculation of the sample size of this study was based on a study by Sánchez (2013![]() ). Sánchez’s work estimated that by the year 2020 there would be 182,597 teachers in Chile. Taking this into account, while using a parameter with a margin of error of 15% and a reliability level of 98%, the necessary sample size would be 540 participants who are currently working within the Chilean educational system.
). Sánchez’s work estimated that by the year 2020 there would be 182,597 teachers in Chile. Taking this into account, while using a parameter with a margin of error of 15% and a reliability level of 98%, the necessary sample size would be 540 participants who are currently working within the Chilean educational system.
The sample of this study is composed of elementary and high school teachers, as well as preschool educators and experts on education who are currently working within the Chilean educational system, at any of its levels. Each participant is a professional educator and is located throughout the various regions of the country, working in institutions situated in rural or urban areas. After validating and going through the collected data, the total number of completed surveys was 696, which is considered a satisfactory real sample size, according to the figures mentioned above. The details of the participants’ demographics will be provided in the first section of the results.
3.3. Procedures
After the development and final calibration of the instrument, the survey was activated on May 5th of 2020 and was kept available for a 44-day period, until June 18th of the same year. During this period, the link to the survey was published on different social media platforms, with LinkedIn being the main platform. Additionally, different educational institutions with educational programs were contacted, in order to reach schools that work as professional internship institutions. Similarly, communication was established with three education faculties of different Chilean universities, two faculty training institutions, and three companies that work as education consultants in order to access their database of faculty members and teachers, as well as university professors that work in teacher training programs.
Since it was an online survey, it can be classified as a self-administered tool, which took approximately ten minutes to answer. To ensure the confidentiality of the data, the collection instrument only asked for the participants’ email addresses for the sole purpose of validating the answers, and these were excluded from the data analysis. A comment section was included, which allowed participants to provide more detail if necessary; however, these comments were only used to provide better insight and were not crossed with the validation information or details of the educational establishment where the participant worked.
Simple data comparison was used for the data analysis, through dynamic charts and statistic program models, to gain an understanding of the reality of the participants. As a part of this, the collected data was analyzed from a descriptive standpoint, allowing for in-depth understanding of the collected information and analysis of the results, using the stated hypothesis as a guide.
4. Results
The following sections will describe the results which were obtained after revising the data and factoring in the variables. The results are visualized in two types of figures: pie and bar charts and graphs. The results are laid out in the following order:
- Participants.
- Working hours and Internet connection.
- Student communication and connectivity.
- Employee activities and resources.
- Faculty support.
- Assessment and satisfaction level.
4.1. Participants
As mentioned in the methodology above, this research dealt with 696 participants from different areas of the country. Table 1 indicates the distribution of participants per region, as well as their teaching level. The results show that most participants are located in the central area of the country, and the areas with the lowest number of participants are the regions of Arica and Ñuble. In addition, regarding the teaching level, almost half the participants (48%) work in elementary education, followed by high school education with 37%, and finally early education with 15% of the sample.
Table-1. Participants per region and teaching level.
Teaching level |
||||
| Region | Initial |
Elementary |
High school |
Overall |
education |
education |
education |
total |
|
| Arica y Parinacota region | 33% |
67% |
0% |
3 |
| Tarapacá region | 13% |
75% |
13% |
8 |
| Antofagasta region | 31% |
38% |
31% |
13 |
| Atacama region | 18% |
55% |
27% |
11 |
| Coquimbo region | 30% |
35% |
35% |
23 |
| Valparaíso region | 11% |
53% |
35% |
79 |
| Metropolitana de Santiago region | 16% |
47% |
37% |
339 |
| Libertador General Bernardo O’Higgins region | 16% |
60% |
24% |
45 |
| Maule region | 5% |
53% |
42% |
38 |
| Ñuble region | 25% |
25% |
50% |
4 |
| Biobío region | 17% |
40% |
43% |
42 |
| La Araucanía region | 14% |
50% |
36% |
28 |
| Los Ríos region | 15% |
55% |
30% |
20 |
| Los Lagos region | 4% |
46% |
50% |
28 |
| Aysén del General Carlos Ibáñez del Campo region | 14% |
14% |
71% |
7 |
| Magallanes region and Antártica Chilena | 0% |
50% |
50% |
8 |
| Overall total | 15% |
48% |
37% |
696 |
The gender and age distribution are illustrated in Table 2, which shows the percentage of participants per generation according to the distinctions made by Chirinos (2009![]() ). Most participants were women, nearly 80%, and 19% were men; 1% of participants preferred not to disclose their gender. In addition, most participants belonged to the Y (Millennial) and Z generations, and are currently forty years or younger, while a smaller proportion corresponded to the X and baby boomer generations.
). Most participants were women, nearly 80%, and 19% were men; 1% of participants preferred not to disclose their gender. In addition, most participants belonged to the Y (Millennial) and Z generations, and are currently forty years or younger, while a smaller proportion corresponded to the X and baby boomer generations.
Table-2. Gender and generational distribution of the participants (Chirinos, 2009![]() )
)
Gender |
||||
| Generation | Men |
Women |
Prefer not to say |
Overall total |
| Generation Y and Z | 17.7% |
80.9% |
1.4% |
430 |
| Generation X and Baby boomers | 21.8% |
77.8% |
0.4% |
266 |
| Overall total | 19.3% |
79.7% |
1.0% |
696 |
Regarding the participants’ years of teaching experience and details of their institutions and teaching level, it was found that the majority has between one and fifteen years’ experience, with a smaller group, only 8%, having over thirty years’ experience. Also, 42% work in partly subsidized institutions of delegated administration, 34% in municipal establishments or local public education, and the remaining 24% work in the private sector. Regarding the geographical distribution of institutions, 91% are located in urban areas and 9% in rural areas, and the majority, 44%, are partly subsidized establishments, followed by 33% and 23% municipal and private establishments, respectively. Note that, despite the different percentages, the participants’ distribution according to the type of school dependance correlates to the distribution of the number of establishments indicated in the report by the Ministry of Education Study Center Statistics Unit (2018![]() ).
).
Finally, over 95% of participants pointed out that their school does have a work plan for this period of on-site class suspension, which will be described in the following section.
4.2. Workday and Internet Connection
Most of the participants had access to the Internet before classes were suspended, with only 5% of participants not having a service provider. With reference to connection types, just over 60% had both connection types (fixed and mobile), 18% only had fixed access, and 19% only had a mobile connection.
Regarding workdays, Figure 1 shows the workload perception by type of school. Almost 80% of respondents indicated working more than usual, compared to 11% and 10% who reported working the same as usual or less, respectively. In addition, the subsidized sector showed a greater proportion of participants who specified that they worked more than usual, followed by public and private schools.
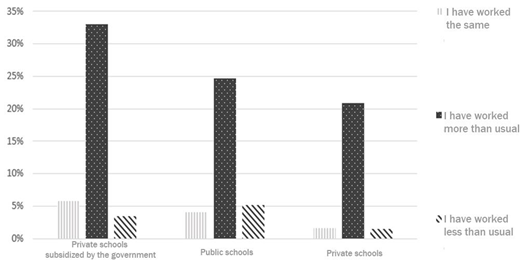
Figure-1. Perception of the work carried out by teachers according to school type.
As for the details of the working hours during this period, almost half of the participants indicated working more than nine hours a day; within that group, 12% worked more than twelve hours. Also, a high percentage of respondents stipulated that they worked between five and eight hours a day, and only 14% worked between one and four hours a day. In terms of workday length, Middle School and High School teachers have the longest days, while in Elementary School almost 70% worked up to eight hours, which is considered a standard workday length.
In respect to Internet stability, Figure 2 shows the stability of participants’ Internet connection per geographical classification. Just over 70% indicated that they were always or almost always able to connect for long periods, 22% managed to connect at times, and 5% stipulated that they were never or almost never able to do so. In greater detail, among both rural and urban schools, the same percentage of teachers indicated they could always connect for long periods, but there were differences within the other categories: 7% more participants from urban schools answered that they could almost always connect. Meanwhile, the categories of never and almost never were chosen by 15% of those who work in rural establishments, in contrast to 5% of urban schools.
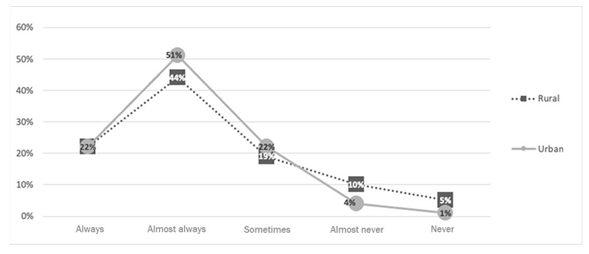
Figure-2. Stability of Internet connection for long periods of time.
4.3. Student Communication and Connectivity
In terms of student communication and connectivity, the communication channels used most frequently were email, instant messaging applications, external virtual platforms, and phone calls. Within these, messaging applications and phone calls appeared with a higher frequency of use, above what is recommended by schools. Other major differences appeared in the use of the school’s intranet and printed communications; these are more highly recommended by institutions than they are used by teachers and students in practice.
Concerning the quality of communication, Figure 3 shows students’ level of connection by socioeconomic level of the school on a scale from 1 to 7, in which 1 corresponds to very bad and 7 to excellent. It illustrates that almost 65% of participants indicated that, on a scale of 1 to 7, they evaluated the communication with students as a 5 or 6, which corresponds to good and very good, respectively; 18% of the sample scored the communication a 4, which is considered a regular quality of communication. Looking deeper into the results, schools that served families from the low and lower-middle socioeconomic groups had a varied communication experience, with the highest number of responses ranging from a rating of 5 downwards, compared to those that served families from the upper and upper-middle strata, where the majority of responses ranged between scores 5 and 7, with no respondents in this group assigning a score of 1.
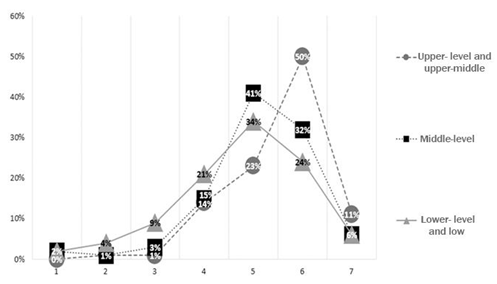
Figure-3. Connection of students depending on the socioeconomic level of the school on a Likert scale.
This may be partly explained by the type and quality of the Internet connection that students and their families had access to, since most teacher-student communications took place through digital media.
Along these lines, Figure 4 illustrates the percentage of students with an Internet connection, according to school socioeconomic level and geographical distribution. Most teachers from schools that served families from the low or lower-middle socioeconomic groups responded that 50% or fewer families had an Internet connection, while the responses from medium level schools showed a more uniform distribution. Meanwhile, most teachers in upper-middle and upper-level establishments responded that more than 90% of their students had an Internet connection at home, both in urban and rural areas. On the other hand, Figure 5 shows the distribution of students with a stable connection for long periods of time depending on the socioeconomic level of the school. The results show a uniform distribution of responses in the three socioeconomic groups, with an observable difference only between the low and lower-middle socioeconomic groups and the upper and upper-middle groups.
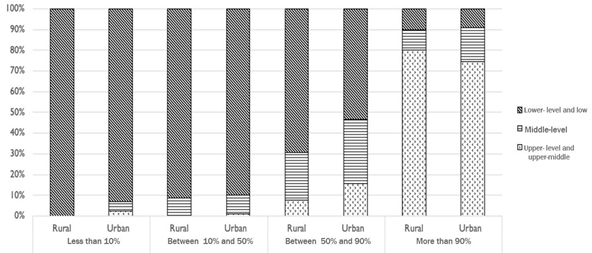
Figure-4. Students with an Internet connection by geographic distribution and socioeconomic level of the school.
4.4. Activities and Resources Used
Regarding the types of activities and resources, Figure 6 illustrates the ones most used by teachers in online teaching during the pandemic. It shows that 20% of the sample sent practice worksheets without a solution, and 18% sent the same resource with the corresponding solution. There was also practical work, such as the creation of videos or infographics, and online work, in which use was made of a digital platform. The lowest percentage in this category was obtained by the activity ‘carrying out projects or research work’ with 10%.
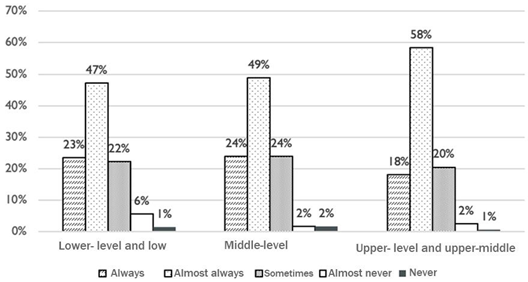
Figure-5. Students with a stable connection for long periods according to the socioeconomic level of the school.
Similarly, Figure 7 shows the proportion of activities actually carried out by students, and it can be seen that 34% of respondents indicated that between 51-80% of the activities were executed, while 32% specified that between 20 and 50% were accomplished. A little more than 10% indicated that less than 20% of the homework or assignments were completed, and, in contrast, almost 20% of the sample specified that their students completed more than 80% of the assigned tasks. Overall, 5% of the participants suggested that they had no information on the amount of work completed by their students.
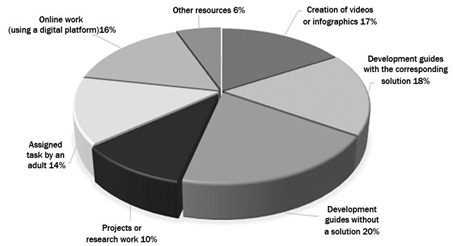
Figure-6. Resources most used by teachers.
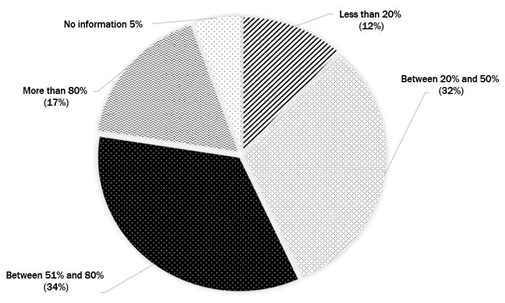
Figure-7. Number of activities carried out by students.
Regarding the amount of content that was covered during this period, 93% of participants indicated that a curricular adaptation and reduction in content had been made before the publication of Priorización Curricular sent by MINEDUC (an analysis of the Chilean Ministry of Education’s curriculum proposal), with the main differences in participant responses being connected to the geographic and socio-economic categorization of their institution. Specifically, 36% of those working in rural schools stipulated that they had carried out curricular adaptation for between 50 and 80% of the content, while for urban establishments this number is 23%. With regards to the socioeconomic level of the school, almost 70% of respondents in establishments that served families from low or lower-middle socioeconomic level indicated a reduction in the content of between 50 and 80%, while only 24% and 23% indicated the same in those facilities that serve middle and upper-middle socioeconomic levels, respectively.
4.5. Teacher Support
Most of the teachers (60%) mentioned that their schools made different support tools available, the most common of which were institutional e-mail and the printing of physical material. The online platform provided by the Ministry (G-Suite) proved to be the least used during this period, followed by free and paid online platforms, both to the same extent. Along with the low use of virtual platforms during the period of this study, 48% of respondents specified that they had not received training on the use of different technologies during this period; of those who had been trained, most evaluated this training in the range of five and above, which corresponds to good to excellent on a scale of one to seven.
With regards to the support and quality of communication established between coordinators and administrators of the educational centers, the majority of the respondents indicated a positive evaluation for both, which ranged from good to excellent. This is illustrated in Figure 8, using the same Likert scale of one to seven, with one corresponding to very bad and seven to excellent. The distribution of responses changed when asked about the support that teachers perceived from MINEDUC, including the quality of official protocols, platforms, and printed materials that were available for students and teachers; in this case responses were distributed mostly between numbers three and five for all the aspects just mentioned, according to the same scale.
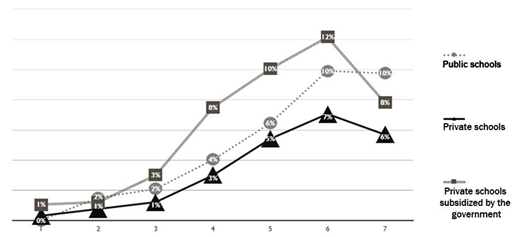
Figure-8. Satisfaction of teachers with the support of their management team on a Likert scale, according to establishment type.
4.6. Evaluation and Level of Satisfaction
The respondents rated the support given to students by educators on the same scale as the previous items. On this matter, almost 45% rated the support level a six, followed by 26% and 24% who rated it seven and five, respectively. Concerning the content delivery, 40% rated it a six, 34% rated it a five, and 15% rated it a seven. When asked about how students performed in the suggested activities, the responses were similar to the previous categories, with 42% rating them a six, 36% five, and 14% seven. The remaining 7% was divided between scores three and four.
In the evaluation of the communication and feedback given to students, in both categories the ranges were again concentrated between grades five and seven. In the case of communication with students, 13% of respondents rated it between grades one and four, and the remaining 88% between five and seven. Similarly, in the feedback category, 18% of responses was concentrated between ratings one to four and the remaining 82% between five and seven.
Subsequently, when asked about the effectiveness of the feedback provided and the students’ acquisition of new knowledge, on a scale of one to seven, one being "not effective" and seven "very effective", 11% indicated they considered the feedback they provided very effective, 34% and 33% indicated that it was effective, scoring it six and five, respectively. Displaying a similar distribution to the dimensions discussed above, 22% of the answers were distributed between moderately effective and not effective, with a score between one and four. In turn, in terms of knowledge acquisition, 2% of respondents indicated that it was very effective, and 21% and 37% rated it six and five, respectively. The remaining 40% of responses was distributed between grades one and four, indicating not effective to moderately effective.
Finally, Figure 9 illustrates educators’ overall level of satisfaction with ERT. In this regard, the scores with the highest frequency are four and five, with 27% and 28%, respectively, which would indicate that the educators are moderately satisfied. On the other hand, 9% rated their satisfaction six or seven, indicating a higher degree of satisfaction, while ratings three, two, and one, which indicate dissatisfaction, demonstrated a higher distribution of responses compared to the previous dimensions, breaking down into 17% rating three, 11% rating two and 8% rating one. Splitting the responses according to the age group participants belonged to, the answers of respondents over the age of forty were mostly distributed between grades four and six (70%), with the remaining 29% between grades one and three. On the other hand, the answers of respondents corresponding to the Millennial and Z generations were mainly distributed between grades three and five with 70%; 23% of respondents rated their experience one or two, and 5% rated it a six. In both age groups, 1% rated their experience a seven; the highest concentrations were in rating five, for the group over forty years of age, and four, for the Millennial and Z generations.
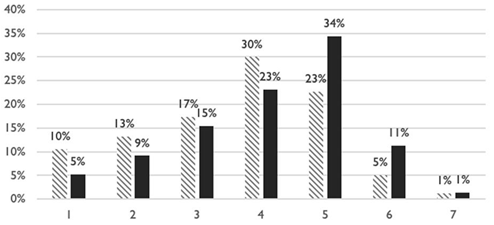
Figure-9. Teacher satisfaction with distance education by age group and generation.
5. Discussion of Results
One of the most valuable findings of this study is around content and curriculum adaptation, since an important decrease in content was made, mainly in rural and lower socioeconomic schools. However, this adaptation was made in schools throughout all geographic and socio-economic classifications, which is an indicator that the teams of professionals were able to act autonomously, since they adjusted their syllabi before the publication of the proposal of the Ministry of Education (2020![]() ), thus responding to the reality of each school and its need for content adaptation.
), thus responding to the reality of each school and its need for content adaptation.
Regarding the educators’ connectivity, it is worth mentioning that the difference between teachers and students at schools in urban and rural sectors does not differ to the extent that was previously thought. Nevertheless, there is a disparity in terms of the possibility to remain connected for long periods for teachers in rural versus urban schools, which provides an indication of the need to improve Internet access in rural areas. However, the results show that the disparities in Internet access are more closely linked to the socio-economic level than the geographical classification, both elements considered by Portillo et al. (2020![]() ) in their description of important factors that present difficulties during Emergency Remote Teaching.
) in their description of important factors that present difficulties during Emergency Remote Teaching.
Another important finding is related to the ways in which communication takes place, since educators are making use of personal calls and messaging services to contact students, more than is encouraged by the school administration. This could indicate a considerable distance between the plans for official communication channels and the actual practice, as well as the possible need for more effective communication. In this regard, as in teacher connectivity, those schools which correspond to a middle and upper socioeconomic level perform better, which in turn affects the teachers’ evaluation of students’ participation and completion of assignments, among others. For this reason, it is important to review the connection status of the families served by each institution to be able to determine work plans tailored to their reality and thus have a positive impact on the conditions under which remote education is implemented. Similarly, the delivery of remote education should be one of the critical focuses of public policies that deal with emergencies such as those experienced during this period.
In terms of teachers’ level of satisfaction with remote education, it can be said that, in general terms, teachers were not completely satisfied with ERT, but only moderately so, which is shown by the normal distribution of the curve. One factor that may influence the level of satisfaction is the number of hours worked compared to a regular period of classes, since most respondents indicated that they worked more hours. Similarly, the study conducted by Tu Clase Tu País (2020![]() ) indicated that a significant number of respondents had workdays of more than eight hours during the remote education period. Another important factor that affects the level of satisfaction is, in this case, the low participation of students in the learning activities during this period. However, a significant number of respondents positively evaluated the effectiveness of knowledge acquisition; this is in contradiction to what was found by Tu Clase Tu País (2020
) indicated that a significant number of respondents had workdays of more than eight hours during the remote education period. Another important factor that affects the level of satisfaction is, in this case, the low participation of students in the learning activities during this period. However, a significant number of respondents positively evaluated the effectiveness of knowledge acquisition; this is in contradiction to what was found by Tu Clase Tu País (2020![]() ), but it is congruent with the findings published by the main universities (see Theoretical Framework, p. 3) in relation to students’ learning. Undoubtedly, the real level of students’ learning is an issue that should be further investigated to obtain concrete data that will help create better public policies in this area.
), but it is congruent with the findings published by the main universities (see Theoretical Framework, p. 3) in relation to students’ learning. Undoubtedly, the real level of students’ learning is an issue that should be further investigated to obtain concrete data that will help create better public policies in this area.
In addition, while more than half of the teachers had some type of training related to remote education, and this was considered useful, the activities carried out were standard; this finding is consistent with the results of the studies mentioned in the previous discussion (see Theoretical Framework, p. 3). On the other hand, teachers felt supported by their management teams, but not by the local or national government, which sheds a light on the difference in the way management teams work and the importance of a thorough knowledge of the empirical reality of the educational environment to enable sound leadership.
Finally, the hypothesis that “teachers belonging to the Millennial and Z generations, under the age of 40, are more satisfied with their performance in distance learning” was disproven, as the results show that their evaluation was mostly lower. This may be related to the expectations they had of remote education, the demands of their own professional work, and the perspective gained through years of teaching experience in the older generations.
6. Conclusions
As mentioned in the Introduction, Chilean educational institutions were faced with using Emergency Remote Education (ERE) in response to the health crisis. This study helps to explain educators’ reality during the initial period of implementation, as well as educators’ perception and evaluation of different aspects related to how remote instruction is carried out. However, because the study was conducted during the first few months of the implementation of remote instruction, its applicability to the process experienced by educators after the end of this research may be limited. For this reason, it would be interesting to replicate this research in an environment that takes into account the conditions after the schools have settled into or finished working with an ERT system.
This study made use of a universal sample composed of educators from different places around the country and belonging to different schools, which provided a general idea of the existing conditions with clear tendencies depending on the geographic and socio-economic classification of the different institutions. Nevertheless, there are limitations related to the sample, which are associated with the number and type of participants in the study. In particular, the sample of educators from rural schools might be less representative of the reality of other rural schools. In addition, along these same lines, another limitation of the sample is that only those educators who had an Internet connection and access to one of the networks through which the survey was distributed could be contacted and were able to access the survey.
Finally, new and more elaborate lines of research could be proposed, such as (1) the learning level of students, and (2) how elements related to remote teaching, such as connectivity, and the type and number of activities to be performed, influence the affective status of educators and students.
Citation:| Gonzalo Cortes Abarca (2021). Implementation of Emergency Remote Teaching in Chilean Schools due to COVID-19. Journal of Education and e-Learning Research, 8(3): 313-323. |
References
Agency for the Quality of Education. (2012). Socio-economic group construction methodology: Simce tests. 18. Retrieved from: http://archivos.agenciaeducacion.cl/Metodologia-de-Construccion-de-Grupos-Socioeconomicos-SIMCE-2012.pdf.
Bustamante, R. (2020). Education in quarantine: When the emergency becomes permanent. Contributions for Dialogue and Action, 1(1), 1-9.
Chirinos, N. (2009). Características generacionales y los valores. Su impacto en lo laboral. Observatorio Laboral Revista Venezolana, 2(4), 133-153.
Education 2020. (2020). Results report #EstamosConectados - Testimonies and experiences of educational communities in the face of the health crisis. Santiago. Retrieved from: http://oped.educacion.uc.cl/website/images/sitio/formacion/estudios/estudios/estudios%20ense%C3%B1anza%20remota/E2020_abril_Estamos_conectados_N1_Informe-Final.pdf.
FNU. (2019). The evolution of distance learning. Florida National University. Retrieved from: https://www.fnu.edu/evolution-distance-learning/.
Gros, B., & Silva, J. (2005). Teacher training as a teacher in virtual learning spaces. Ibero-American Journal of Education, 36(1), 36. Available at: https://doi.org/10.35362/rie3612831.
Hinostroza, E., Matamala, C., Ibeta, A., Labbe, C., Lopez, E., Romero, N., & Claro, M. (2020). Teaching during the health crisis: The gaze of teachers. Published in May, 2020 by Miradadocentes. Retireved from: http://miradadocentes.cl/Informe-de-Resultados_Docencia_Crisis_ Sanitaria.pdf.
Hodges, C., Moore, S., Lockee, B., Trust, T., & Bond, A. (2020). The difference between emergency remote teaching and online learning. Educause Review, 27(1), 1-9.
Ministry of Education. (2020). Annex 13: Guidelines for the implementation of the Curricular Prioritization remotely and in person. July 20th, 2021. Ministry of education. Retrieved from: https://sigamosaprendiendo.mineduc.cl/wp-content/uploads/2020/09/CurriculumPriorizado-2.pdf.
Ministry of Education Study Center Statistics Unit. (2018). Education statistics 2017. Centro de Estudios Mineduc, 112-134. Published in December, 2018. Santiago, Chile. Retrieved from: https://centroestudios.mineduc.cl/wp-content/uploads/sites/100/2018/12/ANUARIO-MINEDUC_VERSION-BAJA.pdf.
Ministry of Telecommunications. (2017). IX internet access and uses survey. Compass Research and Strategy, 12-24. Retrieved from: https://www.subtel.gob.cl/44-de-los-hogares-del-pais-no-tiene-conexion-fija-a-internet/.
OECD. (2019). What is life like in the digital age? Opportunities and risks of digital transformation for people's well-being. Paris: OECD Publishing.
Pérez, A. M. R., Gómez, T. J. J., & Dieguez, G. R. A. (2020). Clinical-epidemiological characteristics of COVID-19. Habanera Journal of Medical Sciences, 19(2), 1-15.
Portillo, P., Samuel Alejandro, Pierra, L. I. C., González, Ó. U. R., & Nogales, O. I. G. (2020). Enseñanza remota de emergencia ante la pandemia Covid-19 en Educación Media Superior y Educación Superior. Propósitos y Representaciones, 8(SPE3), 589. Available at: http://dx.doi.org/10.20511/pyr2020.v8nSPE3.589.
Sánchez, M. J. (2013). Teacher market in the Chilean urban school system. Quality in Education, 39, 155-194. Available at: https://doi.org/10.31619/caledu.n39.81.
Silva, J., Morales, M.-J., Lázaro, J., Gisbert, M., Miranda, P., & Rivoir, A. (2019). Teaching digital competence in initial training: Study from the Cases of Chile and Uruguay. Archives Analytical of Educational Policies, 27(93), 1-30. Available at: https://doi.org/10.14507/epaa.27.3822.
Simonson, M., Zvacek, S., & Smaldino, S. (2019). Teaching and learning at a distance. Charlotte, North Carolina, the United States: Information Age Publishing, Inc.
Steiervalt, A., & Salinas, P. D. (2020). Emergency Remote Teaching: the challenge of making the educational encounter possible. Interfaces in Palermo. 1-5. Retrieved from https://isfd42-bue.infd.edu.ar/sitio/wp-content/uploads/2020/2006/La-planificacio%CC%2081n-en-la-ERDE.pdf.
Tu Clase Tu País. (2020). Study: Radiography of remote learning in Chile. Your class. 2-25. Retrieved from: https://www.tuclase.cl/wp-content/uploads/2020/2007/Radiograf%C2023%ADa-del-Aprendizaje-en-Chile-.pdf.
| Asian Online Journal Publishing Group is not responsible or answerable for any loss, damage or liability, etc. caused in relation to/arising out of the use of the content. Any queries should be directed to the corresponding author of the article. |