Students’ Attitude toward Mathematics and its Relationship with Mathematics Achievement
1Department of Elementary Mathematics Education, Seoul National University of Education, Seoul, Republic of Korea.
2 Department of Mathematics Education, Korea National University of Education, Cheungju, Republic of Korea.
Abstract
The relationship between students’ attitudes toward mathematics and mathematics achievement has garnered tremendous attention from researchers. However, there is a degree of inconsistency in the findings regarding this relationship. Therefore, this study aimed to identify the profiles of students’ attitudes toward mathematics and examine their relationship with mathematics achievement. Using latent profile analysis, we examined data from the Trends in International Mathematics and Science Study conducted in Singapore in 2019. We identified four profiles of attitudes toward mathematics, namely very negative (5.44%), negative (41.38%), neutral (38.77%), and positive (14.41%). We also confirmed the literature describing students’ attitude toward mathematics as a multidimensionally integrated construct, comprising ‘like mathematics,’ ‘value mathematics,’ and ‘confidence in mathematics.’ Moreover, we discovered a positive relationship between students’ attitudes toward mathematics and mathematics achievement. These results showed that the following students are more likely to have high mathematics achievement: (a) those who like to study mathematics and pursue mathematics-related activities, (b) those who believe that learning mathematics will result in a positive outcome (e.g., success in school and job opportunities), and (c) those who trust in their mathematical abilities. Therefore, educators need to examine students’ attitudes toward mathematics and provide appropriate support to stimulate the development of a positive attitude toward mathematics.
Keywords:Attitude toward mathematics, Mathematics achievement, Latent profile analysis, Person-centered approach, Secondary students, Singaporean students, Trends in international mathematics and science study.
Contribution of this paper to the literature: This study is distinguished from previous studies by using latent profile analysis to examine the existence of different groups of students with regard to attitude toward mathematics. Moreover, this study uses nationally representative large samples and controls the effect of teachers’ instructional clarity and home learning resources to examine the relationship between students’ attitudes toward mathematics and mathematics achievement.
1. Introduction
The attitude of students toward mathematics has been the subject of a great deal of attention from educators (e.g., (Chen et al., 2018![]() ; Goldin et al., 2016
; Goldin et al., 2016![]() )). Students with a positive attitude toward mathematics tend to enjoy the subject, understand its value, and have confidence in it; thus, they are likely to prioritize the study of mathematics (Kiwanuka, Van Damme, Van den Noortgate, & Reynolds, 2020
)). Students with a positive attitude toward mathematics tend to enjoy the subject, understand its value, and have confidence in it; thus, they are likely to prioritize the study of mathematics (Kiwanuka, Van Damme, Van den Noortgate, & Reynolds, 2020![]() ; Mullis, Martin, Foy, Kelly, & Fishbein, 2020
; Mullis, Martin, Foy, Kelly, & Fishbein, 2020![]() ), which could lead to high performance in the same (Chouinard, Karsenti, & Roy, 2007
), which could lead to high performance in the same (Chouinard, Karsenti, & Roy, 2007![]() ; Guo, Marsh, Parker, Morin, & Yeung, 2015
; Guo, Marsh, Parker, Morin, & Yeung, 2015![]() ; Wigfield., Tonks, & Klauda, 2016
; Wigfield., Tonks, & Klauda, 2016![]() ) . Although several researchers have reported a positive relationship between students’ attitudes toward mathematics and mathematics achievement (Bhowmik & Roy, 2016
) . Although several researchers have reported a positive relationship between students’ attitudes toward mathematics and mathematics achievement (Bhowmik & Roy, 2016![]() ; Bramlett & Herron, 2009
; Bramlett & Herron, 2009![]() ; Chen et al., 2018
; Chen et al., 2018![]() ; Dowker, Cheriton, Horton, & Mark, 2019
; Dowker, Cheriton, Horton, & Mark, 2019![]() ; Guo et al., 2015
; Guo et al., 2015![]() ; Kadijevich, 2008
; Kadijevich, 2008![]() ; Lipnevich, Preckel, & Krumm, 2016
; Lipnevich, Preckel, & Krumm, 2016![]() ; Ma. & Xu, 2004
; Ma. & Xu, 2004![]() ) , others have reported a nonsignificant association between them (Köller, Baumert, & Schnabel, 2001
) , others have reported a nonsignificant association between them (Köller, Baumert, & Schnabel, 2001![]() ; Mubeen, Saeed, & Arif, 2013
; Mubeen, Saeed, & Arif, 2013![]() ; Papanastasiou, 2000
; Papanastasiou, 2000![]() ; Phonguttha, Tayraukham, & Nuangchalerm, 2009
; Phonguttha, Tayraukham, & Nuangchalerm, 2009![]() ) .
) .
These mixed findings may plausibly be explained by the limitations of previous studies: (a) the use of a variable-centered approach, (b) the omission of crucial covariates, and (c) the examination of small and non-representative samples. First, most previous studies have used a variable-centered approach. These studies examined individual components of attitude (e.g., enjoyment of mathematics and the value placed in mathematics) separately, whereas for individual students these components are interrelated (Di Martino & Zan, 2011![]() ; Mullis et al., 2020
; Mullis et al., 2020![]() ). Second, some previous studies failed to control for the effect of student backgrounds (e.g., (Bhowmik & Roy, 2016
). Second, some previous studies failed to control for the effect of student backgrounds (e.g., (Bhowmik & Roy, 2016![]() ; Lipnevich et al., 2016
; Lipnevich et al., 2016![]() ; Phonguttha et al., 2009
; Phonguttha et al., 2009![]() ) ). When students have sufficient educational learning resources at home, and their teachers provide clear explanations and feedback, they can learn effectively and focus on studying mathematics, which leads to high mathematics achievement (Byrnes & Wasik, 2009
) ). When students have sufficient educational learning resources at home, and their teachers provide clear explanations and feedback, they can learn effectively and focus on studying mathematics, which leads to high mathematics achievement (Byrnes & Wasik, 2009![]() ). However, because some studies did not statistically control for these variables, their results might be biased (Zhu & Chiu, 2019
). However, because some studies did not statistically control for these variables, their results might be biased (Zhu & Chiu, 2019![]() ). Third, a number of studies did not select nationally representative samples and instead used small and non-representative samples (e.g., (Dowker et al., 2019
). Third, a number of studies did not select nationally representative samples and instead used small and non-representative samples (e.g., (Dowker et al., 2019![]() ; Phonguttha et al., 2009
; Phonguttha et al., 2009![]() )). Consequently, these individual studies have examined different types of students and reported mixed findings.
)). Consequently, these individual studies have examined different types of students and reported mixed findings.
Researchers have suggested examining the subgroup of students using a person-centered approach because the relationship between students’ attitude toward mathematics and mathematics achievement could differ according to their characteristics (Berger, Mackenzie, & Holmes, 2020![]() ; Papanastasiou, 2000
; Papanastasiou, 2000![]() ). Therefore, we have opted to examine the existence of different groups of students with regard to their attitude toward mathematics and to examine the relationship between attitudes toward mathematics and mathematics achievement, while keeping in mind the limitations of previous studies.
). Therefore, we have opted to examine the existence of different groups of students with regard to their attitude toward mathematics and to examine the relationship between attitudes toward mathematics and mathematics achievement, while keeping in mind the limitations of previous studies.
2. Literature Review
2.1. Students’ Attitude toward Mathematics
Attitude is a sub-domain of affective science and differs from emotion, as it is more cognitive and stable than emotion (Goldin et al., 2016![]() ). Attitude also differs from belief, as it is less cognitive than belief. Philipp (2007
). Attitude also differs from belief, as it is less cognitive than belief. Philipp (2007![]() ) stated that while “beliefs are psychologically held understanding premises, or propositions about the world…, [attitude is related to] manners of acting, feeling, or thinking that show one’s disposition or opinion” (p. 259). Thus, attitude is a relatively stable psychological tendency toward a particular idea, object, or entity with a certain degree of positivity or negativity (Clore & Schnall, 2005
) stated that while “beliefs are psychologically held understanding premises, or propositions about the world…, [attitude is related to] manners of acting, feeling, or thinking that show one’s disposition or opinion” (p. 259). Thus, attitude is a relatively stable psychological tendency toward a particular idea, object, or entity with a certain degree of positivity or negativity (Clore & Schnall, 2005![]() ). Therefore, students’ attitude toward mathematics can be defined as their comprehensive evaluation of mathematics.
). Therefore, students’ attitude toward mathematics can be defined as their comprehensive evaluation of mathematics.
Researchers have proposed the existence of several components of attitude toward mathematics from multidimensional perspectives. For example, on the basis of survey data from 318 secondary school students in Malaysia, Davadas and Lay (2017![]() ) suggested motivation, enjoyment, self-confidence, and value as components of attitude toward mathematics. Likewise, Di Martino and Zan (2011
) suggested motivation, enjoyment, self-confidence, and value as components of attitude toward mathematics. Likewise, Di Martino and Zan (2011![]() ) examined 1,496 Italian students’ (from grade 2 to grade 13) writing about their personal experiences with mathematics and found three components: “emotional disposition, vision of mathematics, and perceived competence” (p. 15). Similarly, the Trends in International Mathematics and Science Study (TIMSS) researchers examined students’ attitude toward mathematics through three components (Mullis et al., 2020
) examined 1,496 Italian students’ (from grade 2 to grade 13) writing about their personal experiences with mathematics and found three components: “emotional disposition, vision of mathematics, and perceived competence” (p. 15). Similarly, the Trends in International Mathematics and Science Study (TIMSS) researchers examined students’ attitude toward mathematics through three components (Mullis et al., 2020![]() ): enjoyment of mathematics, value of mathematics, and confidence in mathematics. In summary, while different researchers have used different terms, they have commonly measured attitude toward mathematics using three components: like mathematics (LM), value mathematics (VM), and confidence in mathematics (CM).
): enjoyment of mathematics, value of mathematics, and confidence in mathematics. In summary, while different researchers have used different terms, they have commonly measured attitude toward mathematics using three components: like mathematics (LM), value mathematics (VM), and confidence in mathematics (CM).
Many researchers have examined students’ attitudes toward mathematics. However, they have rarely used a person-centered approach, which aids in the examination of different patterns or a combination of variables of each profile. Although few studies have examined the profiles of students’ attitude toward mathematics, most have examined students’ attitude toward mathematics in combination with other constructs. For example, in their study that examined 293 U.S. college students’ attitudes and beliefs toward mathematics, Kalder and Lesik (2011![]() ) noted three latent profiles, which they described as math negative, math neutral, and math positive. Moreover, Berger et al. (2020
) noted three latent profiles, which they described as math negative, math neutral, and math positive. Moreover, Berger et al. (2020![]() ) examined 10,051 Austrian eighth-grade students’ attitudes toward mathematics and science using latent profile analysis (LPA) and found six profiles. Regarding students’ attitude toward mathematics, they found four types of attitudes: negative, neutral, positive, and very positive. Therefore, we might assume that students’ attitudes toward mathematics can be categorized into three or four profiles. However, this assumption should be examined by means of a further study that specifically focuses on students’ attitude toward mathematics.
) examined 10,051 Austrian eighth-grade students’ attitudes toward mathematics and science using latent profile analysis (LPA) and found six profiles. Regarding students’ attitude toward mathematics, they found four types of attitudes: negative, neutral, positive, and very positive. Therefore, we might assume that students’ attitudes toward mathematics can be categorized into three or four profiles. However, this assumption should be examined by means of a further study that specifically focuses on students’ attitude toward mathematics.
2.2. Students’ Attitude toward Mathematics and Mathematics Achievement
Students’ attitudes toward mathematics are formed through their various experiences with mathematics (Davadas & Lay, 2017![]() ; Goldin et al., 2016
; Goldin et al., 2016![]() ). As accumulated experiences with a certain object and subject influence students’ psychological state, they develop a positive or negative attitude toward such experiences. Moreover, students tend to behave and think in a certain way that matches their attitude. For example, students with a positive attitude toward mathematics tend to like mathematics, view it as a valuable subject and have confidence in engaging in the subject (Mullis et al., 2020
). As accumulated experiences with a certain object and subject influence students’ psychological state, they develop a positive or negative attitude toward such experiences. Moreover, students tend to behave and think in a certain way that matches their attitude. For example, students with a positive attitude toward mathematics tend to like mathematics, view it as a valuable subject and have confidence in engaging in the subject (Mullis et al., 2020![]() ). Such students also put more time and effort into studying mathematics. However, students with a negative attitude toward mathematics tend to dislike mathematics, deem it a useless subject and feel afraid to engage in it (Chouinard et al., 2007
). Such students also put more time and effort into studying mathematics. However, students with a negative attitude toward mathematics tend to dislike mathematics, deem it a useless subject and feel afraid to engage in it (Chouinard et al., 2007![]() ; Guo et al., 2015
; Guo et al., 2015![]() ; Wigfield & Eccles, 2000
; Wigfield & Eccles, 2000![]() ; Wigfield. et al., 2016
; Wigfield. et al., 2016![]() ) . As a consequence, such students tend to avoid mathematics-related activities (Cho & Hwang, 2019
) . As a consequence, such students tend to avoid mathematics-related activities (Cho & Hwang, 2019![]() ). Therefore, we might assume the existence of a positive relationship between a student’s attitude toward mathematics and their mathematics achievement.
). Therefore, we might assume the existence of a positive relationship between a student’s attitude toward mathematics and their mathematics achievement.
Some previous studies have found that students’ attitude toward mathematics positively impacts their mathematics achievement (e.g., (Chen et al., 2018![]() ; Dowker et al., 2019
; Dowker et al., 2019![]() ; Kiwanuka et al., 2020
; Kiwanuka et al., 2020![]() ) ). For example, Ma and Kishor (1997
) ). For example, Ma and Kishor (1997![]() ) conducted a meta-analysis of 113 studies and found a positive and statistically significant association between them. In a recent study conducted with 67 English and 49 Chinese students, Dowker et al. (2019
) conducted a meta-analysis of 113 studies and found a positive and statistically significant association between them. In a recent study conducted with 67 English and 49 Chinese students, Dowker et al. (2019![]() ) found that attitude toward mathematics accounted for 26% of the variance in mathematics achievement. Likewise, Kiwanuka et al. (2020
) found that attitude toward mathematics accounted for 26% of the variance in mathematics achievement. Likewise, Kiwanuka et al. (2020![]() ) examined 4,244 seventh-grade Ugandan students’ attitudes toward mathematics using three indicators (LM, VM, and CM) and observed a statistically positive association with their mathematics achievement. Kadijevich (2008
) examined 4,244 seventh-grade Ugandan students’ attitudes toward mathematics using three indicators (LM, VM, and CM) and observed a statistically positive association with their mathematics achievement. Kadijevich (2008![]() ) investigated the association between the same three indicators and mathematics achievement using the TIMSS 2003 grade 8 dataset and found that each element had a significant positive association with mathematics achievement. Because students with higher levels of “value of,” “enjoyment of,” and “confidence in” mathematics are more willing to study mathematics and persevere in the face of adversity, they are likely to achieve superior performance in mathematics (Cho & Hwang, 2019
) investigated the association between the same three indicators and mathematics achievement using the TIMSS 2003 grade 8 dataset and found that each element had a significant positive association with mathematics achievement. Because students with higher levels of “value of,” “enjoyment of,” and “confidence in” mathematics are more willing to study mathematics and persevere in the face of adversity, they are likely to achieve superior performance in mathematics (Cho & Hwang, 2019![]() ; Chouinard et al., 2007
; Chouinard et al., 2007![]() ; Guo et al., 2015
; Guo et al., 2015![]() ) .
) .
Taking a different approach, Chen et al. (2018![]() ) analyzed the association between students’ attitudes toward mathematics and mathematics achievement using functional MRI (fMRI). After analyzing 75 American students’ neural mechanisms in the brain with fMRI, they concluded that a positive attitude toward mathematics was related to enhanced use of memory-based strategies (more frequent memory retrieval), which led to higher mathematics achievement. That is to say, students’ attitudes toward mathematics are a critical factor in their cognitive development, and they can either facilitate or inhibit the acquisition of mathematical knowledge and skills and the students’ consequent achievement in the subject.
) analyzed the association between students’ attitudes toward mathematics and mathematics achievement using functional MRI (fMRI). After analyzing 75 American students’ neural mechanisms in the brain with fMRI, they concluded that a positive attitude toward mathematics was related to enhanced use of memory-based strategies (more frequent memory retrieval), which led to higher mathematics achievement. That is to say, students’ attitudes toward mathematics are a critical factor in their cognitive development, and they can either facilitate or inhibit the acquisition of mathematical knowledge and skills and the students’ consequent achievement in the subject.
However, other studies (e.g., (Köller et al., 2001![]() ; Mubeen et al., 2013
; Mubeen et al., 2013![]() ; Papanastasiou, 2000
; Papanastasiou, 2000![]() ) ) have reported a nonsignificant or mixed relationship between the two. In a longitudinal study that appraised the relationship between attitude toward mathematics and mathematics achievement using 602 German students, Köller et al. (2001
) ) have reported a nonsignificant or mixed relationship between the two. In a longitudinal study that appraised the relationship between attitude toward mathematics and mathematics achievement using 602 German students, Köller et al. (2001![]() ) noted that this relationship differed according to students’ grade levels. They examined the same students at the end of grades 7, 10, and 12 and found no significant association between mathematical achievement and attitude toward mathematics from grade 7 to 10. However, there was a significant association between the two from grade 10 to 12. In light of these mixed findings, Köller et al. (2001
) noted that this relationship differed according to students’ grade levels. They examined the same students at the end of grades 7, 10, and 12 and found no significant association between mathematical achievement and attitude toward mathematics from grade 7 to 10. However, there was a significant association between the two from grade 10 to 12. In light of these mixed findings, Köller et al. (2001![]() ) suggested controlling contextual factors, such as teacher instruction, in future studies. Mubeen et al. (2013
) suggested controlling contextual factors, such as teacher instruction, in future studies. Mubeen et al. (2013![]() ) examined 500 Pakistani secondary students from four schools and reported no significant association between attitude toward mathematics and mathematics achievement. Papanastasiou (2000
) examined 500 Pakistani secondary students from four schools and reported no significant association between attitude toward mathematics and mathematics achievement. Papanastasiou (2000![]() ) examined students from the U.S., Japan, and Cyprus and reported similar findings. As a recommendation for future studies, Papanastasiou (2000
) examined students from the U.S., Japan, and Cyprus and reported similar findings. As a recommendation for future studies, Papanastasiou (2000![]() ) suggested considering the influence of students’ context on their achievement and dividing participants into subgroups, which could reveal a different association between them.
) suggested considering the influence of students’ context on their achievement and dividing participants into subgroups, which could reveal a different association between them.
The lack of congruence in the findings of previous studies regarding the relationship between students’ attitudes toward mathematics and mathematics achievement, has necessitated additional research in this area. Previous studies have suggested the use of a person-centered approach to identify profiles in students’ attitudes toward mathematics (Berger et al., 2020![]() ). The focus of person-centered approaches is on the categorization of individuals into distinct groups according to their responses to several variables (Parker et al., 2021
). The focus of person-centered approaches is on the categorization of individuals into distinct groups according to their responses to several variables (Parker et al., 2021![]() ). Thus, the person-centered approach helps researchers more accurately understand the characteristics of a group of students, which might differ from other groups of students. Additionally, person-centered approaches can simultaneously examine the multi-construct of a non-cognitive element using advanced statistical methods, such as LPA (Estévez, Rodríguez-Llorente, Piñeiro, González-Suárez, & Valle, 2021
). Thus, the person-centered approach helps researchers more accurately understand the characteristics of a group of students, which might differ from other groups of students. Additionally, person-centered approaches can simultaneously examine the multi-construct of a non-cognitive element using advanced statistical methods, such as LPA (Estévez, Rodríguez-Llorente, Piñeiro, González-Suárez, & Valle, 2021![]() ). Therefore, we have employed LPA to examine the existence of different groups of students with regard to attitudes toward mathematics. Moreover, we made use of student data from TIMSS, conducted in Singapore in 2019, and controlled the effect of teachers’ instructional clarity and home learning resources as covariables for enhancing statistical accuracy. The findings of this study are anticipated to enhance the extant understanding of profiles of attitude toward mathematics and the relationship between students’ attitudes toward mathematics and mathematics achievement. On the basis of the literature review, two hypotheses were developed.
). Therefore, we have employed LPA to examine the existence of different groups of students with regard to attitudes toward mathematics. Moreover, we made use of student data from TIMSS, conducted in Singapore in 2019, and controlled the effect of teachers’ instructional clarity and home learning resources as covariables for enhancing statistical accuracy. The findings of this study are anticipated to enhance the extant understanding of profiles of attitude toward mathematics and the relationship between students’ attitudes toward mathematics and mathematics achievement. On the basis of the literature review, two hypotheses were developed.
Hypothesis 1. There are three (negative, neutral, and positive) or four (negative, neutral, positive, and very positive) profiles of students’ attitude toward mathematics.
Hypothesis 2. Students with a more positive attitude toward mathematics tend to have higher mathematics achievement.3. Methods
3.1. Data Collection and Sampling
In this study, we used data from TIMSS 2019 to examine the research hypotheses. TIMSS is one of the most extensively used international mathematics and science tests (Mullis et al., 2020![]() ). TIMSS was designed to examine fourth and eighth graders’ mathematics and science achievements and to survey various factors influencing student achievement, including students’ affective domain, classroom contexts, teacher characteristics, and home backgrounds. TIMSS was initiated in 1995 and has been implemented every four years since then. In 2019, students in 69 countries participated in the test. TIMSS researchers implemented a stratified cluster sampling to amass the data (Martin, Von Davier, & Mullis, 2020
). TIMSS was designed to examine fourth and eighth graders’ mathematics and science achievements and to survey various factors influencing student achievement, including students’ affective domain, classroom contexts, teacher characteristics, and home backgrounds. TIMSS was initiated in 1995 and has been implemented every four years since then. In 2019, students in 69 countries participated in the test. TIMSS researchers implemented a stratified cluster sampling to amass the data (Martin, Von Davier, & Mullis, 2020![]() ). First, the researchers selected nationally representative schools in a country, considering school location, size, and socioeconomic status. Then, they randomly selected one or two classrooms from individual schools.
). First, the researchers selected nationally representative schools in a country, considering school location, size, and socioeconomic status. Then, they randomly selected one or two classrooms from individual schools.
The current study examined the data of Singaporean eighth-grade students because Singaporean students have been selected and analyzed by a number of researchers as a global benchmark (Toh, Kaur, & Tay, 2019![]() ). The participants included 4,853 students (2,486 boys, 2,366 girls, and one non-responding student) from 153 schools, and their mean age was 14.34 (SD = 0.408).
). The participants included 4,853 students (2,486 boys, 2,366 girls, and one non-responding student) from 153 schools, and their mean age was 14.34 (SD = 0.408).
3.2.1. Attitude toward Mathematics
To measure students’ attitude toward mathematics, three factors (LM, VM, and CM), which were covered by 27 items in TIMSS 2019, were used (Martin et al., 2020![]() ). LM comprised nine items (e.g., “I like mathematics,” p. 248), VM consisted of nine items (e.g., “Learning mathematics will give me more job opportunities when I am an adult,” p. 266), and CM included nine items (e.g., “I am good at mathematics,” p. 220). The full survey items were made available by Martin et al. (2020
). LM comprised nine items (e.g., “I like mathematics,” p. 248), VM consisted of nine items (e.g., “Learning mathematics will give me more job opportunities when I am an adult,” p. 266), and CM included nine items (e.g., “I am good at mathematics,” p. 220). The full survey items were made available by Martin et al. (2020![]() ).
).
The items used a 4-point Likert scale ranging from agree a lot (1) to disagree a lot (4). Some items were reverse-coded to indicate that the higher score indicated a more positive attitude toward mathematics. The Cronbach’s alpha coefficients were .936 for LM, 0.867 for VM, 0.907 for CM, and 0.943 for the overall scale. TIMSS researchers constructed a scale for each factor using item response theory to compare the data with that of other countries. The mean score of the scale was 10 (SD = 2) across all participating countries. We used the scale score of LM, VM, and CM for this study.
3.2.2. Mathematics Achievement
The grade 8 TIMSS mathematics assessment contained 14 similarly designed student achievement booklets, which included approximately 220 mathematics items (Martin et al., 2020![]() ). Each item was classified into content and cognitive domains. The former included data and probability (20%), algebra (30%), numbers (30%), and geometry (20%). The latter required cognitive thinking to solve problems, which consisted of knowing (35%), applying (40%), and reasoning (25%). The knowing domain assessed basic concepts, facts, and procedures, whereas the applying domain examined students’ conceptual understanding and ability to apply learned knowledge to solve problems. The reasoning domain required students to interpret complex and unfamiliar contexts and solve them. As TIMSS covered most domains of mathematics, we concluded that it was an appropriate test to investigate students’ mathematics achievement. Each student in TIMSS completed a booklet (about 25 items) to reduce the test burden (Martin et al., 2020
). Each item was classified into content and cognitive domains. The former included data and probability (20%), algebra (30%), numbers (30%), and geometry (20%). The latter required cognitive thinking to solve problems, which consisted of knowing (35%), applying (40%), and reasoning (25%). The knowing domain assessed basic concepts, facts, and procedures, whereas the applying domain examined students’ conceptual understanding and ability to apply learned knowledge to solve problems. The reasoning domain required students to interpret complex and unfamiliar contexts and solve them. As TIMSS covered most domains of mathematics, we concluded that it was an appropriate test to investigate students’ mathematics achievement. Each student in TIMSS completed a booklet (about 25 items) to reduce the test burden (Martin et al., 2020![]() ). Therefore, their achievement was provided with five plausible values. The overall mean score was 500 across all countries (SD = 100). We aggregated the five plausible values for the current study. The overall mean achievement score of Singaporean eighth-grade students was 612.70, with a standard deviation of 96.67.
). Therefore, their achievement was provided with five plausible values. The overall mean score was 500 across all countries (SD = 100). We aggregated the five plausible values for the current study. The overall mean achievement score of Singaporean eighth-grade students was 612.70, with a standard deviation of 96.67.
Researchers have found that students’ achievement in mathematics is affected by their home backgrounds and by teacher quality (Byrnes & Wasik, 2009![]() ). Therefore, the following two variables in TIMSS data were used as control variables. First, student’s home educational resources for learning, which tend to be strongly related to students’ socioeconomic status, were controlled. The scale was calculated on the basis of nine items (e.g., computer tablet, study desk, own room, and internet connection, among the home resources). Second, the instructional quality of the teachers was controlled. Students appraised the instructional clarity of their mathematics teachers in seven items. TIMSS researchers calculated their scale scores using item response theory. The mean score of each scale was 10 (SD = 2) across all participating countries.
). Therefore, the following two variables in TIMSS data were used as control variables. First, student’s home educational resources for learning, which tend to be strongly related to students’ socioeconomic status, were controlled. The scale was calculated on the basis of nine items (e.g., computer tablet, study desk, own room, and internet connection, among the home resources). Second, the instructional quality of the teachers was controlled. Students appraised the instructional clarity of their mathematics teachers in seven items. TIMSS researchers calculated their scale scores using item response theory. The mean score of each scale was 10 (SD = 2) across all participating countries.
The study data were analyzed in three stages. First, the correlations between the three factors of attitude toward mathematics (LM, VM, and CM) and mathematics achievement were analyzed. Second, LPA was performed to determine the attitude profiles toward mathematics. In accordance with previous studies (Jung & Wickrama, 2008![]() ; Parker et al., 2021
; Parker et al., 2021![]() ; Tein, Coxe, & Cham, 2013
; Tein, Coxe, & Cham, 2013![]() ; Tueller & Lubke, 2010
; Tueller & Lubke, 2010![]() ) , the following criteria were used to identify the optimal number of classes: (1) information-based criteria, (2) likelihood ratio tests, (3) entropy, and (4) sample size. For the information-based criteria, we calculated Akaike information criteria (AIC), Bayesian information criterion (BIC), and sample-size-adjusted BIC (SABIC). Lower AIC, BIC, and SABIC values indicated a more optimal model fit. With regard to the likelihood ratio tests, which were used to statistically compare models, Lo–Mendell–Rubin maximum likelihood ratio test (LMRT) and bootstrap likelihood ratio test (BLRT) were used. The significant LMRT and BLRT values indicated that K profiles had a better model fit than K−1 profiles. The entropy evaluated the classification accuracy of a model, and higher values represented a more accurate classification. Regarding the sample size of each subgroup, the recommended size is at least 5% of the total sample size (Parker et al., 2021
) , the following criteria were used to identify the optimal number of classes: (1) information-based criteria, (2) likelihood ratio tests, (3) entropy, and (4) sample size. For the information-based criteria, we calculated Akaike information criteria (AIC), Bayesian information criterion (BIC), and sample-size-adjusted BIC (SABIC). Lower AIC, BIC, and SABIC values indicated a more optimal model fit. With regard to the likelihood ratio tests, which were used to statistically compare models, Lo–Mendell–Rubin maximum likelihood ratio test (LMRT) and bootstrap likelihood ratio test (BLRT) were used. The significant LMRT and BLRT values indicated that K profiles had a better model fit than K−1 profiles. The entropy evaluated the classification accuracy of a model, and higher values represented a more accurate classification. Regarding the sample size of each subgroup, the recommended size is at least 5% of the total sample size (Parker et al., 2021![]() ; Tueller & Lubke, 2010
; Tueller & Lubke, 2010![]() ). Because AIC and entropy were less accurate, however, we focused on other indices for the selection of the most optimal model (Tein et al., 2013
). Because AIC and entropy were less accurate, however, we focused on other indices for the selection of the most optimal model (Tein et al., 2013![]() ). Moreover, we calculated posteriori probabilities of the selected model to determine the classification accuracy. We then implemented a multivariate analysis of variance (MANOVA) to examine the differences between profiles in the three components of attitude toward mathematics, followed by post hoc tests with the Bonferroni method. Third, we conducted the analysis of covariance (ANCOVA) to analyze the differences between different profiles in terms of mathematics achievement. We used students’ home educational resources and their teachers’ instructional clarity as control variables. To examine the magnitude of the differences between groups, we calculated the Cohens’ d effect size. We used Statistical Package for the Social Sciences (SPSS) 24.0 and Mplus 8.2 to carry out data analyses.
). Moreover, we calculated posteriori probabilities of the selected model to determine the classification accuracy. We then implemented a multivariate analysis of variance (MANOVA) to examine the differences between profiles in the three components of attitude toward mathematics, followed by post hoc tests with the Bonferroni method. Third, we conducted the analysis of covariance (ANCOVA) to analyze the differences between different profiles in terms of mathematics achievement. We used students’ home educational resources and their teachers’ instructional clarity as control variables. To examine the magnitude of the differences between groups, we calculated the Cohens’ d effect size. We used Statistical Package for the Social Sciences (SPSS) 24.0 and Mplus 8.2 to carry out data analyses.
4. Results
4.1. Descriptive and Correlation Analysis
The results of the descriptive statistics and Pearson correlations are encapsulated in Table 1. The correlation analysis showed that correlations between all three components of attitude toward mathematics were significant, ranging from .356 (VM and CM) to .699 (LM and CM). Moreover, the correlations between the three components and mathematics achievement were positively significant, ranging from 0.137 (VM and mathematics achievement) to .377 (CM and mathematics achievement).
Table-1. Descriptive and correlation analysis.
M |
SD |
1 |
2 |
3 |
4 |
||
| 1. LM | 10.07 |
1.79 |
0.936 |
- |
0.542 *** |
0.699 *** |
0.302 *** |
| 2. VM | 9.66 |
1.71 |
0.867 |
- |
0.356 *** |
0.137 *** |
|
| 3. CM | 9.65 |
2.18 |
0.907 |
- |
0.377 *** |
||
| 4. Mathematics achievement | 612.70 |
96.67 |
- |
Note: *** p < .001, = Cronbach’s alpha, LM = like mathematics, VM = value mathematics, and CM = confidence in mathematics.
4.2. Identification of Attitude toward Mathematics Profiles
To examine the model fits of latent profiles, LPA was performed. Each model fit was examined consecutively by increasing the number of latent classes by one (see Table 2). The process was stopped when a model did not indicate statistical improvement compared to the previous model according to LMRT or BLRT. In this study, the analysis was terminated at the six-class model and the four-class model was selected as the best-fitting model for the following two reasons. First, the sample sizes of all groups in the four-class model were greater than 5% of the total sample, whereas the five- and six-class models had at least one group with less than 5% of the total sample (Tueller & Lubke, 2010![]() ). Second, except for the five- and six-class models, the AIC, BIC, and SABIC values of the four-class model were the lowest, while its entropy was lower than that of the three-class model. Note that BIC and SABIC had higher statistical accuracy than the entropy value for the selection of the optimal model (Tein et al., 2013
). Second, except for the five- and six-class models, the AIC, BIC, and SABIC values of the four-class model were the lowest, while its entropy was lower than that of the three-class model. Note that BIC and SABIC had higher statistical accuracy than the entropy value for the selection of the optimal model (Tein et al., 2013![]() ). Table 3 shows the classification accuracy and the number of students in each class of the four-class model. The bold font in the main diagonal indicates the coefficients associated with each group whose subjects were assigned. All coefficients had a high classification accuracy, and values greater than 0.80.
). Table 3 shows the classification accuracy and the number of students in each class of the four-class model. The bold font in the main diagonal indicates the coefficients associated with each group whose subjects were assigned. All coefficients had a high classification accuracy, and values greater than 0.80.
Table-2. Model fit indices for different latent class models.
AIC |
BIC |
SABIC |
Entropy |
LMRT |
BLRT |
Number of Groups with n < 5% |
|
| 1 profile | 59,793.248 |
59,832.171 |
59,813.105 |
0 |
|||
| 2 profiles | 56,936.095 |
57,000.967 |
56,969.19 |
0.734 |
< 0.001 |
< 0.001 |
0 |
| 3 profiles | 55,526.675 |
55,617.495 |
55,573.008 |
0.813 |
< 0.001 |
< 0.001 |
0 |
| 4 profiles | 55,034.047 |
55,150.815 |
55,093.618 |
0.747 |
< 0.01 |
< 0.001 |
0 |
| 5 profiles | 54,744.726 |
54,887.443 |
54,817.535 |
0.781 |
< 0.01 |
< 0.001 |
1 |
| 6 profiles | 54,594.566 |
54,763.231 |
54,680.613 |
0.778 |
0.12 |
< 0.001 |
2 |
Note: Bold fond indicates the selected model.
Table-3. Classification accuracy and latent profiles of students in individual profiles.
Latent Profiles |
||||||
1 |
2 |
3 |
4 |
n |
% |
|
| Class 1 | 0.835 |
0.165 |
0.000 |
0.000 |
263 |
5.44 |
| Class 2 | 0.015 |
0.857 |
0.000 |
0.128 |
2007 |
41.38 |
| Class 3 | 0.000 |
0.000 |
0.887 |
0.113 |
699 |
14.41 |
| Class 4 | 0.000 |
0.143 |
0.033 |
0.824 |
1880 |
38.77 |
Note: Bold fond indicates the coefficients associated with each group.
Next, a MANOVA technique was performed to analyze the contribution of LM, VM, and CM to the categorization of each group (see Table 4). The results revealed significant differences between the four classes (λPillai = .882, F(9, 14535) =672.848; p < 0.001, ηp2 = 0.29) with a small effect size. Also, significant differences between the four classes in LM (F(3, 4845) =7414.709, p < 0.001, ηp2 = 0.82), VM (F(3, 4845) =847.614, p < 0.001, ηp2 = 0.34), and CM (F(3, 4845) =2257.226, p < 0.001, ηp2 = 0.58) were observed. These results indicated that each of the variables contributed to the differences between classes. Therefore, it is safe to conclude that the four-class model is the most appropriate.
4.3. Description of the Profiles of Attitude toward Mathematics
Table 4 shows the mean scores of each latent profile in the four-class model. To examine the characteristics of each profile more clearly, the Z scores of each variable were computed, see Figure 1. The first group (n = 263, 5.44%, very negative attitude toward mathematics) was characterized by very low levels of all three components of attitude toward mathematics. The second group (n = 2,007, 41.38%, negative attitude toward mathematics) included students with low levels of all three components of attitude toward mathematics. The LM, VM, and CM scores of these two groups were lower than the mean scores. The third group (n = 699, 14.41%, positive attitude toward mathematics) exhibited high scores of the three components of attitude toward mathematics. The fourth group (n = 1,880, 38.77%, neutral attitude toward mathematics) was defined by moderate levels of all three components of attitude toward mathematics. In contrast to the first two groups, the LM, VM, and CM scores of the last two groups were higher than or equal to the mean scores.
Table-4. Results of MANOVA with the three attitude variables.
| Variable | Group 1 (n = 263) |
Group 2 (n = 2,007) |
Group 3 (n = 699) |
Group 4 (n = 1,880) |
Significance and Effect Sizes |
||||||
M |
SD |
M |
SD |
M |
SD |
M |
SD |
F |
P |
ηp2 |
|
| LM | 6.42 |
1.02 |
8.95 |
0.74 |
13.00 |
0.82 |
10.70 |
0.71 |
7414.709 |
< 0.001 |
0.82 |
| VM | 8.02 |
1.66 |
8.86 |
1.25 |
11.60 |
1.48 |
10.02 |
1.43 |
847.614 |
< 0.001 |
0.34 |
| CM | 5.74 |
1.89 |
8.49 |
1.33 |
12.51 |
1.85 |
10.37 |
1.21 |
2257.236 |
< 0.001 |
0.58 |
Note: LM = like mathematics, VM = value mathematics, and CM = confidence in mathematics.
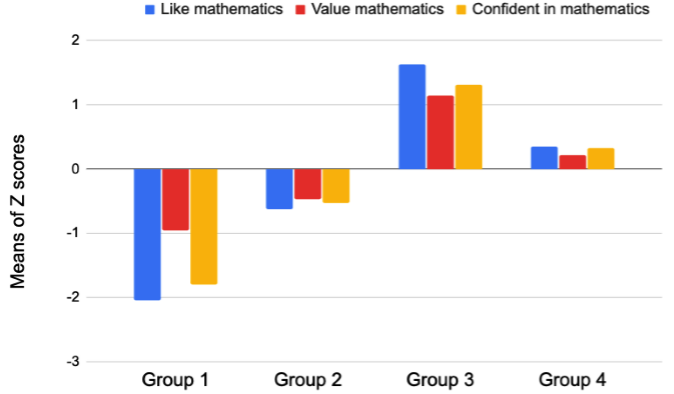
Figure-1. The Computed Z scores of attitudes toward mathematics profiles.
Note: Group 1: very negative attitude toward mathematics; Group 2: negative attitude toward mathematics; Group 3: positive attitude toward mathematics; Group 4: neutral attitude toward mathematics.
4.4. Differences in Mathematics Achievement
An ANCOVA technique was performed, and the analysis results showed significant differences between the means of the four groups (F (3, 4839) = 136.541, p < 0.001, ηp2 = 0.078). The results demonstrated that after controlling for the teachers’ instructional clarity and home educational learning resources, mathematics achievement was significantly different according to the attitude toward mathematics profiles. The results of the Bonferroni post hoc analysis showed that all mean differences between any two groups were statistically significant. For example, Group 3, which included students with positive attitudes toward mathematics, had higher mathematics achievement than the remaining three groups (see Table 5). These findings revealed that students with a positive attitude toward mathematics tended to have high mathematics achievement. However, the effect size was somewhat small; the attitude toward mathematics profiles explained only 7.8% of the variance in achievement.
Table-5. Descriptive statistics and mean differences in mathematics achievement for individual profiles.
Class |
M |
SD |
Confidence Interval |
Mean Differences |
|||
Lower 5% |
Upper 5% |
Class 1 |
Class 2 |
Class 3 |
|||
1 |
548.60 |
5.41 |
538.00 |
559.21 |
- |
||
2 |
590.92 |
1.95 |
>587.09 |
594.75 |
42.32 *** |
- |
|
3 |
646.09 |
3.41 |
639.40 |
652.77 |
97.49 *** |
55.17 *** |
- |
4 |
632.70 |
1.98 |
628.81 |
636.58 |
84.10 *** |
41.78 *** |
13.39 *** |
Note: *** p < 0.001, Bonferroni post hoc analysis was used.
5. Discussion
An incongruence has been observed in the findings of studies on the relationship between students’ attitudes toward mathematics and their mathematics achievement. Therefore, this study aimed to identify profiles of students’ attitudes toward mathematics and examine the relationship between them. We used a person-centered approach, controlled student background variables, and used nationally representative large samples to take into account the limitations of previous studies. Regarding the first hypothesis, four profiles were identified, namely, very negative (n = 263; 5.44%), negative (n = 2,007; 41.38%), neutral (n = 1,880; 38.77%), and positive (n = 699; 14.41%) attitudes toward mathematics. These findings are, in part, in accordance with those of Kalder and Lesik (2011![]() ), who examined U.S. college students and found three profiles of attitude toward mathematics (i.e., negative, neutral, and positive) and with the study by Berger et al. (2020
), who examined U.S. college students and found three profiles of attitude toward mathematics (i.e., negative, neutral, and positive) and with the study by Berger et al. (2020![]() ), which examined Austrian eighth-grade students and found four types of attitudes toward mathematics (i.e., negative, neutral, positive, and very positive). In contrast to previous studies, however, we found a student group with a very negative attitude toward mathematics that had not been previously reported. This difference might be due to the fact that the two above-mentioned studies examined profiles of attitude toward mathematics and another construct, such as attitude toward science, simultaneously.
), which examined Austrian eighth-grade students and found four types of attitudes toward mathematics (i.e., negative, neutral, positive, and very positive). In contrast to previous studies, however, we found a student group with a very negative attitude toward mathematics that had not been previously reported. This difference might be due to the fact that the two above-mentioned studies examined profiles of attitude toward mathematics and another construct, such as attitude toward science, simultaneously.
Furthermore, in contrast to previous studies, we examined Asian secondary school students. Studies have reported that Asian students are likely to have negative attitudes toward mathematics due to the expectations of their socializers, such as teachers and parents (Kung & Lee, 2016![]() ; Martin et al., 2020
; Martin et al., 2020![]() ; Papanastasiou, 2000
; Papanastasiou, 2000![]() ; Uchida & Mori, 2018
; Uchida & Mori, 2018![]() ) . Because Asian parents and teachers are concerned about students’ mathematics achievement, they demand students study more and perform well in tests, which results in the development of negative attitudes toward mathematics. However, further research should be conducted to validate the findings of this study.
) . Because Asian parents and teachers are concerned about students’ mathematics achievement, they demand students study more and perform well in tests, which results in the development of negative attitudes toward mathematics. However, further research should be conducted to validate the findings of this study.
Moreover, we found significant differences among the four groups, with a large effect size in EM, a small effect size in VM, and a moderate effect size in CM. The group with a very negative attitude toward mathematics had the lowest levels of LM, VM, and CM, whereas the group with a positive attitude toward mathematics had the highest levels of each. Moreover, the correlations among the three components were significant, and a group with higher scores on LM tended to have higher scores on VM and CM as well (r = 0.356 ~ 0.699). On the basis of the results of correlation analysis and LPA, we were able to confirm the literature describing students’ attitudes toward mathematics as a multidimensionally integrated construct of LM, VM, and CM (Martin et al., 2020![]() ). The findings of this study are also in accordance with those of a study examining Italian students’ attitude toward mathematics using their autobiographical writing about their experiences with the subject (Di Martino & Zan, 2011
). The findings of this study are also in accordance with those of a study examining Italian students’ attitude toward mathematics using their autobiographical writing about their experiences with the subject (Di Martino & Zan, 2011![]() ). A possible explanation for the relationship between CM and VM was provided by a study conducted with 759 seventh-grade to eleventh-grade students in Canada (Chouinard et al., 2007
). A possible explanation for the relationship between CM and VM was provided by a study conducted with 759 seventh-grade to eleventh-grade students in Canada (Chouinard et al., 2007![]() ). Chouinard et al. (2007
). Chouinard et al. (2007![]() ) reported that students who have confidence in mathematics tend to be aware of the present and the future usefulness of mathematics. Furthermore, in a three-year longitudinal study of six middle school students, Cho and Hwang (2019
) reported that students who have confidence in mathematics tend to be aware of the present and the future usefulness of mathematics. Furthermore, in a three-year longitudinal study of six middle school students, Cho and Hwang (2019![]() ) found that student enjoyment, confidence, and value in mathematics were intertwined, and that a change in one component led to a change in the other components. For example, a student who disliked mathematics made less effort to succeed in the subject and lost their confidence, causing them to be unaware of the value of mathematics over time. Building upon previous empirical evidence, the association between LM, CM, and VM provided us with a deeper understanding of the characteristics of students with negative or positive attitudes toward mathematics.
) found that student enjoyment, confidence, and value in mathematics were intertwined, and that a change in one component led to a change in the other components. For example, a student who disliked mathematics made less effort to succeed in the subject and lost their confidence, causing them to be unaware of the value of mathematics over time. Building upon previous empirical evidence, the association between LM, CM, and VM provided us with a deeper understanding of the characteristics of students with negative or positive attitudes toward mathematics.
The second objective of this study was to analyze the association between student profiles of attitude toward mathematics and mathematics achievement. The study findings revealed that the student group with a positive attitude toward mathematics tended to have higher mathematics achievement than the student group with a negative attitude toward mathematics, although the effect size was small. These results showed that the following students are more likely to have high mathematics achievement: (a) those who like to study mathematics and pursue mathematics-related activities, (b) those who believe that learning mathematics will result in a positive outcome (e.g., success in school and job opportunities), and (c) those who trust in their mathematical abilities. Students who lack these three psychological components, however, are likely to be low achievers in mathematics. These results substantiate the second hypothesis. However, these findings were inconsistent with some previous studies reporting a nonsignificant association between attitude toward mathematics and mathematics achievement (e.g., (Mubeen et al., 2013![]() )). These differences might be caused by the fact that we controlled student background variables, examined a large sample of data, and used LPA.
)). These differences might be caused by the fact that we controlled student background variables, examined a large sample of data, and used LPA.
The findings of this study corroborate those of previous studies that reported a positive relationship between students’ attitudes toward mathematics and mathematics achievement (e.g., (Dowker et al., 2019![]() ; Kiwanuka et al., 2020
; Kiwanuka et al., 2020![]() )). This phenomenon could be partially explained by expectancy–value theory (Wigfield & Eccles, 2000
)). This phenomenon could be partially explained by expectancy–value theory (Wigfield & Eccles, 2000![]() ; Wigfield et al., 2016
; Wigfield et al., 2016![]() ). Wigfield and Eccles (2000
). Wigfield and Eccles (2000![]() ) explained that student achievement was influenced by their perception of “interest/enjoyment value, attainment value, utility value, and relative cost” (p. 72) of a certain subject. The student group who liked mathematics, had high levels of expectancy for their success in mathematics, were aware of the value of mathematics, and believed that studying mathematics was more important than studying other subjects tended to spend a considerable amount of time and effort on studying mathematics. Consequently, their endeavor to study mathematics contributed to high achievement in the subject (Chouinard et al., 2007
) explained that student achievement was influenced by their perception of “interest/enjoyment value, attainment value, utility value, and relative cost” (p. 72) of a certain subject. The student group who liked mathematics, had high levels of expectancy for their success in mathematics, were aware of the value of mathematics, and believed that studying mathematics was more important than studying other subjects tended to spend a considerable amount of time and effort on studying mathematics. Consequently, their endeavor to study mathematics contributed to high achievement in the subject (Chouinard et al., 2007![]() ; Guo et al., 2015
; Guo et al., 2015![]() ). Therefore, we can assume that students with positive attitudes toward mathematics tend to pursue mathematic-related activities and have high levels of mathematical motivation, which may help them have higher mathematics achievement than students with a negative attitude toward the subject. From a different perspective, a student’s positive attitude toward mathematics might increase their mathematics-related hippocampal activity and memory-retrieval activity in the brain, which could help them to achieve high performance (Chen et al., 2018
). Therefore, we can assume that students with positive attitudes toward mathematics tend to pursue mathematic-related activities and have high levels of mathematical motivation, which may help them have higher mathematics achievement than students with a negative attitude toward the subject. From a different perspective, a student’s positive attitude toward mathematics might increase their mathematics-related hippocampal activity and memory-retrieval activity in the brain, which could help them to achieve high performance (Chen et al., 2018![]() ). However, further studies should be carried out to verify these assumptions.
). However, further studies should be carried out to verify these assumptions.
6. Conclusions
This study has identified students’ profiles of attitude toward mathematics and examined the relationship between attitude and mathematical achievement using the data of Singaporean eighth-grade students. The findings emphasize the important role of attitude toward mathematics, which contributes to achieving high performance in the subject. Students should therefore be provided with educational interventions to develop a positive attitude toward mathematics. These interventions could include the following: (a) teachers could prepare interesting mathematical tasks to engage their students in mathematics lessons and enable them to enjoy mathematics; (b) school administrators could provide teachers with educational resources (e.g., technological devices) and professional development programs to help them implement various instructional strategies in the mathematics classroom that would allow students to learn about the subject in an enjoyable manner; (c) parents and teachers could provide accurate feedback and support to help students acquire accurate mathematical knowledge and develop confidence in mathematics; (d) teachers could adjust the difficulties of mathematical tasks by considering their students’ mathematical performance to ensure all students experience success in the mathematics classroom; (e) parents and teachers could help students acquire awareness of the value of mathematics in their present and future life.
Moreover, teachers should be aware of their students’ differing attitudes toward mathematics. As evidenced by this study, students can have different attitudes toward mathematics, and they might need different kinds of support according to the individual components of their attitude toward mathematics. Therefore, teachers need to examine their students’ attitude and provide appropriate support to stimulate the development of a positive attitude toward the subject. More practically, teachers could use the survey utilized in TIMSS to examine their students. Furthermore, researchers should conduct additional studies to identify the factors leading to the development of students’ negative attitude toward mathematics. These efforts might help students develop a positive attitude toward mathematics and therefore achieve a higher performance level in the subject.
This study has a few limitations. First, the study used students’ self-reported survey data to examine their attitude toward mathematics, which is very prevalent in quantitative research. However, it is possible that students manipulated their responses to the survey to give the researchers the impression they were good students. Second, the study only examined Singaporean eighth-grade students. Therefore, a study of students in other countries and other grade levels might reveal different outcomes, and the findings of this study cannot be generalized to other contexts. Third, only two variables (teacher instructional clarity and home educational resources) were controlled, and attitude toward mathematics only accounted for 7.8% of the variance in students’ mathematics achievement. Therefore, other variables might affect the relationship between them, such as principal leadership (Chen, Ning, & Bos, 2020![]() ) and previous mathematics achievement (Hemmings, Grootenboer, & Kay, 2011
) and previous mathematics achievement (Hemmings, Grootenboer, & Kay, 2011![]() ). Finally, the directionality between attitude toward mathematics and mathematics achievement was not clear. As the reason for the positive relationship between the two, we assumed that students’ attitudes toward mathematics affect their mathematics achievement. However, an opposite or bidirectional relationship could be possible. Therefore, readers should be cautious when interpreting the findings of this study.
). Finally, the directionality between attitude toward mathematics and mathematics achievement was not clear. As the reason for the positive relationship between the two, we assumed that students’ attitudes toward mathematics affect their mathematics achievement. However, an opposite or bidirectional relationship could be possible. Therefore, readers should be cautious when interpreting the findings of this study.
Further studies should therefore be conducted in light of the aforementioned limitations. First, future studies might use additional data, such as interview and classroom observation data, to validate the results of the study. Second, more studies are required to examine the relationship between attitude toward mathematics and mathematics achievement using students in other contexts. Third, further efforts are required to identify different variables affecting mathematics achievement and control their effects on student mathematics achievement. Moreover, longitudinal studies should be conducted to examine the directionality between attitude toward mathematics and mathematics achievement. Such future studies could enhance the understanding of the relationship between students’ attitude toward mathematics and mathematics achievement.
Citation:| Sunghwan Hwang; Taekwon Son (2021). Students’ Attitude toward Mathematics and its Relationship with Mathematics Achievement. Journal of Education and e-Learning Research, 8(3): 272-280. |
References
Berger, N., Mackenzie, E., & Holmes, K. (2020). Positive attitudes towards mathematics and science are mutually beneficial for student achievement: A latent profile analysis of TIMSS 2015. The Australian Educational Researche, 47, 409–444. Available at: https://doi.org/10.1007/s13384-020-00379-8.
Bhowmik, M., & Roy, B. B. (2016). A study on the relationship between achievement in mathematics and attitude towards mathematics of secondary school students. Scholar, 1(2), 49–55. Available at: https://doi.org/10.21013/jems.v4.n3.p7.
Bramlett, D. C., & Herron, S. (2009). A study of African-American college students’ attitude towards mathematics. Journal of Mathematical Science & Mathematics Education, 3(2), 43–51.
Byrnes, J. P., & Wasik, B. A. (2009). Factors predictive of mathematics achievement in kindergarten, first and third grades: An opportunity–propensity analysis. Contemporary Educational Psychology, 34(2), 167–183. Available at: https://doi.org/10.1016/j.cedpsych.2009.01.002.
Chen, L., Bae, S. R., Battista, C., Qin, S., Chen, T., Evans, T. M., & Menon, V. (2018). Positive attitude toward math supports early academic success: Behavioral evidence and neurocognitive mechanisms. Psychological Science, 29(3), 390–402. Available at: https://doi.org/10.1177/0956797617735528.
Chen, D., Ning, B., & Bos, W. (2020). Relationship between principal leadership and students’ mathematics achievement: A comparative study between Germany and Chinese Taipei. Asia Pacific Journal of Education, 40, 1–17. Available at: https://doi.org/10.1080/02188791.2020.1816899.
Cho, E. H., & Hwang, S. H. (2019). Exploring changes in multi-ethnic students' mathematics achievement motivation: A longitudinal study using expectancy-value theory. The Mathematical Education, 58(1), 101-120. Available at: https://doi.org/10.7468/mathedu.2019.58.1.101.
Chouinard, R., Karsenti, T., & Roy, N. (2007). Relations among competence beliefs, utility value, achievement goals, and effort in mathematics. British Journal of Educational Psychology, 77(3), 501–517. Available at: https://doi.org/10.1348/000709906x133589.
Clore, G. L., & Schnall, S. (2005). The influence of affect on attitudes. In Albarracin, D., Johnson, B. T., & Zanna, M. P. (Eds.), The Handbook of Attitudes (pp. 437–489). Mahwah, NJ: Erlbaum.
Davadas, S. D., & Lay, Y. F. (2017). Factors affecting students’ attitude toward mathematics: A structural equation modeling approach. Eurasia Journal of Mathematics, Science and Technology Education, 14(1), 517–529. Available at: https://doi.org/10.12973/ejmste/80356.
Di Martino, P., & Zan, R. (2011). Attitude towards mathematics: A bridge between beliefs and emotions. ZDM, 43(4), 471–482. Available at: https://doi.org/10.1007/s11858-011-0309-6.
Dowker, A., Cheriton, O., Horton, R., & Mark, W. (2019). Relationships between attitudes and performance in young children’s mathematics. Educational Studies in Mathematics, 100(3), 211–230. Available at: https://doi.org/10.1007/s10649-019-9880-5.
Estévez, I., Rodríguez-Llorente, C., Piñeiro, I., González-Suárez, R., & Valle, A. (2021). School engagement, academic achievement, and self-regulated learning. Sustainability, 13(6), 1-15. Available at: https://doi.org/10.3390/su13063011.
Goldin, G. A., Hannula, M. S., Heyd-Metzuyanim, E., Jansen, A., Kaasila, R., Lutovac, S., & Zhang, Q. (2016). Attitudes, beliefs, motivation and identity in mathematics education: An overview of the field and future directions. ICME-13 topical survey. Cham, Switzerland: Springer.
Guo, J., Marsh, H. W., Parker, P. D., Morin, A. J., & Yeung, A. S. (2015). Expectancy-value in mathematics, gender and socioeconomic background as predictors of achievement and aspirations: A multi-cohort study. Learning and Individual Differences, 37, 161-168. Available at: https://doi.org/10.1016/j.lindif.2015.01.008.
Hemmings, B., Grootenboer, P., & Kay, R. (2011). Predicting mathematics achievement: The influence of prior achievement and attitudes. International Journal of Science and Mathematics Education, 9(3), 691-705. Available at: https://doi.org/10.1007/s10763-010-9224-5.
Jung, T., & Wickrama, K. A. (2008). An introduction to latent class growth analysis and growth mixture modeling. Social and Personality Psychology Compass, 2(1), 302–317. Available at: https://doi.org/10.1111/j.1751-9004.2007.00054.x.
Kadijevich, D. J. (2008). TIMSS 2003: Relating dimensions of mathematics attitude to mathematics achievement. Proceedings of the Institute for Pedagogical Research, 40(2), 327–346. Available at: https://doi.org/10.2298/ZIPI0802327K.
Kalder, R. S., & Lesik, S. A. (2011). A classification of attitudes and beliefs toward mathematics for secondary mathematics pre-service teachers and elementary pre-service teachers: An exploratory study using latent class analysis. Issues in the Undergraduate Mathematics Preparation of School Teachers, 5, 1–20.
Kiwanuka, H. N., Van Damme, J., Van den Noortgate, W., & Reynolds, C. (2020). Temporal relationship between attitude toward mathematics and mathematics achievement. International Journal of Mathematical Education in Science and Technology, 51, 1–25. Available at: https://doi.org/10.1080/0020739x.2020.1832268.
Köller, O., Baumert, J., & Schnabel, K. (2001). Does interest matter? The relationship between academic interest and achievement in mathematics. Journal for Research in Mathematics Education, 32(5), 448–470. Available at: https://doi.org/10.2307/749801.
Kung, H. Y., & Lee, C. Y. (2016). Multidimensionality of parental involvement and children's mathematics achievement in Taiwan: Mediating effect of math self-efficacy. Learning and Individual Differences, 47, 266–273. Available at: https://doi.org/10.1016/j.lindif.2016.02.004.
Lipnevich, A. A., Preckel, F., & Krumm, S. (2016). Mathematics attitudes and their unique contribution to achievement: Going over and above cognitive ability and personality. Learning and Individual Differences, 47, 70–79. Available at: https://doi.org/10.1016/j.lindif.2015.12.027.
Ma, X., & Kishor, N. (1997). Assessing the relationship between attitude toward mathematics and achievement in mathematics: A meta-analysis. Journal for Research in Mathematics Education, 28, 26–47. Available at: https://doi.org/10.2307/749662.
Ma., X., & Xu, J. (2004). Determining the causal ordering between attitude toward mathematics and achievement in mathematics. American Journal of Education, 110(3), 256–280. Available at: https://doi.org/10.1086/383074.
Martin, M. O., Von Davier, M., & Mullis, I. V. (2020). Methods and procedures: TIMSS 2019 technical report. Paper presented at the TIMSS & PIRLS International Association for the Evaluation of Educational Achievement.
Mubeen, S., Saeed, S., & Arif, M. H. (2013). Attitude towards mathematics and academic achievement in mathematics among secondary level boys and girls. Journal of Humanities and Social Science, 6(4), 38–41. Available at: https://doi.org/10.9790/0837-0643841.
Mullis, I. V. S., Martin, M. O., Foy, P., Kelly, D. L., & Fishbein, B. (2020). TIMSS 2019 international results in mathematics and science. Paper presented at the TIMSS & PIRLS International Association for the Evaluation of Educational Achievement.
Papanastasiou, C. (2000). Effects of attitudes and beliefs on mathematics achievement. Studies in Educational Evaluation, 26(1), 27–42. Available at: https://doi.org/10.1016/s0191-491x(00)00004-3.
Parker, P. C., Perry, R. P., Hamm, J. M., Chipperfield, J. G., Pekrun, R., Dryden, R. P., . . . Tze, V. M. (2021). A motivation perspective on achievement appraisals, emotions, and performance in an online learning environment. International Journal of Educational Research, 108, 101772.
Philipp, R. A. (2007). Mathematics teachers’ beliefs and affect. In F. Lester (Ed.), Second handbook of research on mathematics teaching and learning (pp. 257–315). Reston, VA: National Council of Teachers of Mathematic.
Phonguttha, R., Tayraukham, S., & Nuangchalerm, P. (2009). Comparisons of mathematics achievement, attitude towards mathematics and analytical thinking between using the geometer’s sketchpad program as media and conventional learning activities. Australian Journal of Basic and Applied Sciences, 3(3), 3036–3039. Available at: https://doi.org/10.2139/ssrn.1285446.
Tein, J. Y., Coxe, S., & Cham, H. (2013). Statistical power to detect the correct number of classes in latent profile analysis. Structural Equation Modeling, 20(4), 640-657. Available at: https://doi.org/10.1080/10705511.2013.824781.
Toh, T. L., Kaur, B., & Tay, E. G. (2019). Mathematics education in Singapore. Gateway East, Singapore: Springer Nature.
Tueller, S., & Lubke, G. (2010). Evaluation of structural equation mixture models: Parameter estimates and correct class assignment. Structural Equation Modeling, 17(2), 165-192. Available at: https://doi.org/10.1080/10705511003659318.
Uchida, A., & Mori, K. (2018). Detection and treatment of fake math-dislikes among Japanese junior high school students. International Journal of Science and Mathematics Education, 16(6), 1115-1126. Available at: https://doi.org/10.1007/s10763-017-9825-3.
Wigfield, A., & Eccles, J. S. (2000). Expectancy–value theory of achievement motivation. Contemporary Educational Psychology, 25(1), 68–81. Available at: https://doi.org/10.1006/ceps.1999.1015.
Wigfield, A., Tonks, S. M., & Klauda, S. L. (2016). Expectancy-value theory. In Wentzel, K. R., & Miele, D. B. (Eds.), Handbook of motivation at school (pp. 55–74). New York: Routledge.
Zhu, J., & Chiu, M. M. (2019). Early home numeracy activities and later mathematics achievement: Early numeracy, interest, and self-efficacy as mediators. Educational Studies in Mathematics, 102(2), 173–191. Available at: https://doi.org/10.1007/s10649-019-09906-6.
| Asian Online Journal Publishing Group is not responsible or answerable for any loss, damage or liability, etc. caused in relation to/arising out of the use of the content. Any queries should be directed to the corresponding author of the article. |