Implementation of a Tracker-Assisted Modeling Activity in an Online Advanced Physics Experiment Course
1Physics Education Postgraduate Program, Yogyakarta State University, Indonesia, Department of Physics Education, Widya Mandala Catholic University Surabaya, Indonesia.
2,3Physics Education Postgraduate Program, Yogyakarta State University, Indonesia.
Abstract
Experiment or laboratory work is an essential part of physics and other science courses. However, due to the COVID-19 pandemic, face-to-face classes have had to be transformed into remote classes. Because laboratory access has become very limited, technology must be utilized to substitute for hands-on activity in laboratory-based courses. Additionally, maintaining students’ motivation during remote classes is also challenging. In this paper, we report on the implementation of modeling activities using Tracker in our online Advanced Physics Experiment course. We examine the effectiveness of Tracker-assisted modeling activity in improving students’ graph interpretation skills on the topic of Fraunhofer-Diffraction. The results show that 20 out of 21 participants demonstrated an increase in graph interpretation skills. The average normalized gain is 0.74, which can be seen as a high degree of improvement. Although the activity did not allow students to practice hands-on skills, this activity can encourage students to practice other science-related skills. Moreover, according to the survey, students feel more motivated to learn physics online after being exposed to the modeling activity.
Keywords:Modeling, Physics experiment, Graph interpretation, Learning motivation, Online course.
Contribution of this paper to the literature: This study contributes to the existing literature on modeling theory in physics education, learning through technology, and online learning. This paper explains the implementation of a modeling approach in an undergraduate online laboratory-based physics course. Tracker is used to facilitate the modeling of a physics phenomenon in an online class. The findings of this study confirm that the Tracker-assisted modeling activity improves students' graph interpretation skills and their learning motivation in an online class.
1. Introduction
As digital technology has developed rapidly, distance learning has undergone a significant transformation. In the past, the main problem of distance learning was the lack of interaction between teachers and students. However, with the growing accessibility of the internet and advanced communication technologies, that obstacle can for the most part be overcome. However, distance learning still poses significant challenges, especially for science courses. In this case, the problem is mainly related to the incorporation of laboratory work and experiments in distance learning (Aththibby, Kuswanto, & Mundilarto, 2021![]() ).
).
Laboratory work is an indispensable part of science courses; it encourages students to inquire independently, think critically, and practice generating scientific information. Previous studies have also demonstrated that students' attitudes toward science improve when they take part in laboratory work. Moreover, it is an essential component for the creation of a meaningful understanding of scientific concepts (Sadoglu & Durukan, 2018![]() ).
).
The COVID-19 pandemic, which started in early 2020, has affected education systems around the world. Schools have been forced to close to minimize the spread of the virus. Hence, students and teachers have been forced to adapt their face-to-face courses into a suitable mode for remote online learning. Teachers have been required to design online courses in a very short period of time. For the Physics Education Department, the main challenge has been to transform practical-based courses into online learning. The practical-based courses are usually conducted in a laboratory and require hands-on activity, but direct access to a laboratory is impossible in the case of online learning. However, although they cannot completely replace hands-on activity, certain technologies can be implemented as alternatives (Aththibby et al., 2021![]() ; Campari et al., 2021
; Campari et al., 2021![]() ; Pols, 2020
; Pols, 2020![]() ) .
) .
In this paper, we explore the solution of using the video modeling software Tracker to enable students to collect data from the video of an experiment, analyze the data, and create models. Instead of students conducting a hands-on experiment in the lab, the teacher records the experiment and provides the students with a video. The students then observe the physical phenomena in the video and collect quantitative data using Tracker (Brown & Cox, 2009![]() ). Over the past years, Tracker has been widely used in the physics education community to enhance face-to-face physics courses (Castaneda, 2019
). Over the past years, Tracker has been widely used in the physics education community to enhance face-to-face physics courses (Castaneda, 2019![]() ; Eddy, 2016
; Eddy, 2016![]() ; Trocaru, Berlic, Miron, & Barna, 2020
; Trocaru, Berlic, Miron, & Barna, 2020![]() ) . The learning activity investigated in this study is based on modeling. Modeling-based learning encourages students to construct a scientific model or solve a particular problem like a real scientist (Cascarosa, Sánchez-Azqueta, Gimeno, & Aldea, 2020
) . The learning activity investigated in this study is based on modeling. Modeling-based learning encourages students to construct a scientific model or solve a particular problem like a real scientist (Cascarosa, Sánchez-Azqueta, Gimeno, & Aldea, 2020![]() ). Although this online activity may not facilitate practical laboratory competencies, such as correctly using apparatus or laboratory safety, on the other hand it can stimulate students to develop other competencies, such as data skills and communication skills.
). Although this online activity may not facilitate practical laboratory competencies, such as correctly using apparatus or laboratory safety, on the other hand it can stimulate students to develop other competencies, such as data skills and communication skills.
Specifically, this study explores how practicing modeling activity using Tracker affects one particular data skill – graph interpretation. Graphs are method of data visualization that is widely used in various fields. To anticipate their future career paths, students must become proficient at interpreting graphs (Ergül, 2018![]() ).
).
2. Literature Review
2.1. Models and Modeling in Physics Learning
In physics, a model is a simplified version of a part of the targeted physical world. Based on the representation method, models can be categorized into six types: concrete models, verbal models, visual models, mathematical models, action models, and a mix of those models (Buckley & Boulter, 2000![]() ).
).
Modeling is the process scientists use to construct a scientific model or solve a particular problem. Although modeling originated as a process carried out by scientists, it has also been adapted as a part of the science learning process (Wang, Jou, Lv, & Huang, 2018![]() ). Students can use the process of modeling to develop their scientific knowledge. The principle of modeling in learning science is based on the construction of a mental model to understand a phenomenon and then using this cognitive model to solve a problem.
). Students can use the process of modeling to develop their scientific knowledge. The principle of modeling in learning science is based on the construction of a mental model to understand a phenomenon and then using this cognitive model to solve a problem.
Several learning cycles based on modeling have been proposed. Hestenes described the physics modeling process as comprised of three main parts: modeling, model analysis, and model validation (Hestenes, 1997![]() ). Halloun (2007
). Halloun (2007![]() ) developed a learning cycle based on the modeling process, consisting of exploration, model adduction, model formulation, model deployment, and paradigmatic synthesis (Halloun, 2007
) developed a learning cycle based on the modeling process, consisting of exploration, model adduction, model formulation, model deployment, and paradigmatic synthesis (Halloun, 2007![]() ). Meanwhile, Brew proposed five steps of modeling: introduction and representation; coordination of representation; application; abstraction and generalization; and continued incremental development (Brewe, 2008
). Meanwhile, Brew proposed five steps of modeling: introduction and representation; coordination of representation; application; abstraction and generalization; and continued incremental development (Brewe, 2008![]() ). Another study developed the strategy of modeling-based flipped learning. The flipped learning stages consist of exploration, model adduction, model formulation, and model deployment (Wang et al., 2018
). Another study developed the strategy of modeling-based flipped learning. The flipped learning stages consist of exploration, model adduction, model formulation, and model deployment (Wang et al., 2018![]() ). Several studies have demonstrated the positive impacts of model-based learning. The implementation of model-based learning in schools can reduce alternative conceptions, clarify disagreements between intuition and physics phenomena, improve students’ argumentation skills, connect theory and experimental data, improve problem-solving strategies, integrate new concepts with prior knowledge or other disciplines, and help students to understand the image of nature (Cascarosa et al., 2020
). Several studies have demonstrated the positive impacts of model-based learning. The implementation of model-based learning in schools can reduce alternative conceptions, clarify disagreements between intuition and physics phenomena, improve students’ argumentation skills, connect theory and experimental data, improve problem-solving strategies, integrate new concepts with prior knowledge or other disciplines, and help students to understand the image of nature (Cascarosa et al., 2020![]() ).
).
2.2. Graph Interpretation Skill
One of the critical competences in the twenty-first century is working with data, including data analysis (Glazer, 2015![]() ). Data analysis is often practiced in physics class, although data analysis skills are used in various real-life applications. Constructing and interpreting visual data presentation in the form of a graph is among the data analysis skills. In physics, a graph can also serve as a powerful model representation to describe the behavior of physical phenomena (Stefanel, 2019
). Data analysis is often practiced in physics class, although data analysis skills are used in various real-life applications. Constructing and interpreting visual data presentation in the form of a graph is among the data analysis skills. In physics, a graph can also serve as a powerful model representation to describe the behavior of physical phenomena (Stefanel, 2019![]() ). They can reduce the cognitive load and promote cognitive thinking (Pospiech, 2019
). They can reduce the cognitive load and promote cognitive thinking (Pospiech, 2019![]() ). If students are trained in interpreting graphs, it will be useful not only to their understanding of physical concepts but will also contribute to the future workforce’s crucial data skills.
). If students are trained in interpreting graphs, it will be useful not only to their understanding of physical concepts but will also contribute to the future workforce’s crucial data skills.
2.3. E-Learning in Physics and Its Challenges
Distance learning has existed for some time. Following developments in internet and computer technology, distance learning has become increasingly facilitated. As the internet has become more accessible around the world, the concept of electronic-learning or e-learning has emerged. Nowadays, there is a wide variety of e-learning platforms for teachers and students to use. In the past, the frequency of direct interaction between teachers and students was very low during distance learning. However, with the current communication technologies, such as online meeting applications, direct interaction between teachers and students during distance learning has become easier (Pratama, Azman, Kassymova, & Duisenbayeva, 2020![]() ).
).
A learning management system (LMS) also serves to facilitate e-learning. With an LMS, such as Moodle, a teacher can design and organize interactive and effective material, discussion, and assessment. E-learning is not only used for courses that are entirely based on distance learning. Teachers can combine regular face-to-face classroom teaching with e-learning. This combination has led to the concepts of blended learning and flipped learning. Shurygin and Sabirova (2017![]() ) discuss the implementation of blended learning in physics teaching through the use of the LMS Moodle. They found several positive impacts, such as allowing personalization of the education process and motivating students to work independently (Shurygin & Sabirova, 2017
) discuss the implementation of blended learning in physics teaching through the use of the LMS Moodle. They found several positive impacts, such as allowing personalization of the education process and motivating students to work independently (Shurygin & Sabirova, 2017![]() ).
).
The COVID-19 pandemic has forced school closures to minimize human physical contact. Educational institutions have had to redesign face-to-face classes as remote classes. Although some teachers and students have experienced e-learning before, the sudden change has been challenging for some courses. There has been a considerable impact on practical courses, such as physics experiment courses. When hands-on experiments in the laboratory are no longer an option, teachers need to find alternative learning methods. Computer and mobile technologies provide some alternative activities. These include computer simulations (Bayrak, 2008![]() ; Develaki, 2017
; Develaki, 2017![]() ; Habibi, Jumadi, & Mundilarto, 2020
; Habibi, Jumadi, & Mundilarto, 2020![]() ; Pratidhina, Pujianto, & Sumardi, 2019
; Pratidhina, Pujianto, & Sumardi, 2019![]() ) simple experimental projects with readily available tools (including smartphone sensors) (Arribas, Escobar, & Suarez, 2015
) simple experimental projects with readily available tools (including smartphone sensors) (Arribas, Escobar, & Suarez, 2015![]() ; Pili & Violanda, 2018
; Pili & Violanda, 2018![]() ), pre-recorded video demonstrations, live demonstrations (Kestin, Miller, Mccarty, Callaghan, & Deslauriers, 2020
), pre-recorded video demonstrations, live demonstrations (Kestin, Miller, Mccarty, Callaghan, & Deslauriers, 2020![]() ) and remote laboratories (Hoyer & Girwidz, 2018
) and remote laboratories (Hoyer & Girwidz, 2018![]() ).
).
2.4. Tracker as a Video Modeling Tool in Physics Teaching
Tracker is a useful video modeling tool in physics teaching. The software was developed on the Open-Source Physics Java code library. Hence, students and teachers can download and use it for free. Tracker provides various features for analyzing experimental data that has been recorded in a video file. In Tracker, users can track the position, velocity, and acceleration of a moving object (Brown, 2020![]() ). Moreover, Tracker also has an RGB line profile feature that can be used to analyze spectra (Pratidhina, Dwandaru, & Kuswanto, 2020
). Moreover, Tracker also has an RGB line profile feature that can be used to analyze spectra (Pratidhina, Dwandaru, & Kuswanto, 2020![]() ; Rodrigues, Marques, & Sime, 2016
; Rodrigues, Marques, & Sime, 2016![]() ). This feature helps to generate a light intensity distribution graph in light diffraction, interference, or polarization experiments. Various papers have described how to use Tracker for modeling and understanding physics topics in high school and undergraduate courses, including harmonic motion (Kinchin, 2016
). This feature helps to generate a light intensity distribution graph in light diffraction, interference, or polarization experiments. Various papers have described how to use Tracker for modeling and understanding physics topics in high school and undergraduate courses, including harmonic motion (Kinchin, 2016![]() ) free fall (Wee, Tan, & Leong, 2015
) free fall (Wee, Tan, & Leong, 2015![]() ) projectile motion (Wee, Chew, Goh, Tan, & Lee, 2012
) projectile motion (Wee, Chew, Goh, Tan, & Lee, 2012![]() ) rotational dynamic (Eadkhong, Rajsadorn, Jannual, & Danworaphong, 2012
) rotational dynamic (Eadkhong, Rajsadorn, Jannual, & Danworaphong, 2012![]() ) electricity and magnetism (Aguilar-Marin, Chaves-Bacilio, & Jáuregui-Rosas, 2018
) electricity and magnetism (Aguilar-Marin, Chaves-Bacilio, & Jáuregui-Rosas, 2018![]() ) refraction (Ürek, Özdemir, & Coramik, 2021
) refraction (Ürek, Özdemir, & Coramik, 2021![]() ) and reflection(Rodrigues. & Carvalho, 2014
) and reflection(Rodrigues. & Carvalho, 2014![]() ). In previous studies, the implementation of Tracker as a pedagogy tool has revealed several advantages, such as improving learning motivation (Wee et al., 2015
). In previous studies, the implementation of Tracker as a pedagogy tool has revealed several advantages, such as improving learning motivation (Wee et al., 2015![]() ) increasing conceptual understanding (Amaliah, Darmadi, & Saehana, 2020
) increasing conceptual understanding (Amaliah, Darmadi, & Saehana, 2020![]() ) and developing conceptual thinking (Hockicko, Krišták, & Miroslav, 2015
) and developing conceptual thinking (Hockicko, Krišták, & Miroslav, 2015![]() ).
).
3. Research Methods
3.1. Research Design
This study investigated the effectiveness and students' opinion of modeling-based learning activities using Tracker to study an undergraduate online physics experiment. A one-group pre- and post-test design was used in the study. Pre- and post-tests were administered before and after students were exposed to the Tracker-assisted modeling activity.
3.2. Research Participants
The research was conducted at the Physics Education Department of Widya Mandala Catholic University Surabaya, Indonesia. We asked all undergraduate students taking the Advanced Physics Experiment course in 2020 to participate in the learning activity. In total, 21 students participated. They consisted of 7 male and 14 female students. All students participated in the online course using a laptop and had reasonably reliable internet access.
3.3. Instrument
The instruments used in this research are pre-test, post-test and questionnaire. The pre- and post-test are used to investigate how the learning activity affects graph interpretation skills. The pre-and post-test consist of five questions related to graph interpretation skills; students are given 20 minutes to complete them. To get the students' feedback on the learning activity, they were asked to fill in a Likert scale questionnaire.
3.4 Data Analysis
To describe the comparison between the pre- and post-test, we use normalized gain, as an indicator. The formula to calculate normalized gain is provided in Equation 1. The criteria of the normalized gain score are shown in Table 1.
where is the post-test score in percentage, is the pre-test score in percentage. Both individual normalized gain and class average normalized gain are calculated.
Table-1. Criteria of the normalized gain score Hake (1998![]() )
)
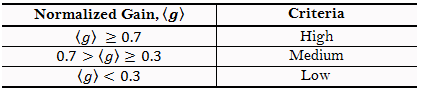
Source: Criteria adopted from Hake (1998![]() ).
).
4. Result and Discussion
4.1. Learning Activity
The participants involved in this study were students taking an Advanced Physics Experiment class. This course is mandatory in the Physics Education major. Before students take this course, they complete the course Physics II, in which they study the theory of diffraction. Therefore, the students who participated in this study had a prior theoretical model of single-slit diffraction. The learning process involved synchronous and asynchronous sessions. The synchronous session was conducted using Zoom. Meanwhile, the asynchronous sessions used the Moodle platform. The learning phases are outlined in Table 2.
Table-2. The learning activity phases.
| Phase | Description | Platform |
| 1.Pre-test | The pre-test was given to students online before they participated in the modeling activity. | Moodle |
| 2.Introduction to Tracker | This phase was conducted both asynchronously and synchronously. Before the synchronous class, students watched a video explaining how to install and use Tracker to analyze physics experiments. All students had Tracker installed on their computer before the first synchronous class. | Moodle and Zoom |
| 2.Orientation | In the orientation, the lecturer introduced students to the experimental set-up of diffraction with a single slit. The lecturer demonstrated how to conduct the experiment, and students were asked to observe the resulting diffraction pattern. Students were also asked to hypothesize how variation of slit width, screen-slit distance, and light wavelength would affect the diffraction pattern. | Zoom |
| 3.Exploration | To test their hypothesis, students need to do an investigation. In normal laboratory work, students would do hands-on experiments directly. However, in this online course, instead of a hands-on experiment, the lecturer provided a recorded video of the diffraction experiment with a single slit. The video showed the diffraction pattern when the slit width, screen-slit distance, and light wavelength were varied. Students had to import the video to Tracker and then plot the diffraction pattern's intensity distribution with the Line Profile feature in Tracker (see Figures 1 and 2). | Moodle |
| 4.Model adduction | Students were asked to identify the difference of intensity distribution in the diffraction pattern when the slit width, screen-slit distance and wavelength were varied. They could discuss it in groups using Moodle forum. | Moodle |
| 5.Model formulation | After discussing their observation and analysis results, students were asked to conduct theoretical modeling of single slit diffraction. Students also had to incorporate the experimental results and the light intensity equation yield in the modeling process. To help students connect the theoretical equation with the experimental result, they could use Excel to plot the light intensity at each point. | Moodle |
| 6.Reflection | Finally, students reflected on the activities that they had carried out. They evaluated the limitations of the activity and gave their ideas of how to improve the experimental result. After the whole process, students were asked to write and submit a report. | Moodle |
| 7.Post-test | After submitting their task, students did a post-test. The post-test consisted of the same questions as the pre-test. Students had to complete it within 20 minutes. After finishing the post-test, students were asked to fill in a questionnaire asking their views on the use of Tracker in the online Advanced Physics Experiment course. | Moodle |
4.2. Effect of the Learning Activity
Overall, the results of this study show that using Tracker to carry out a modeling activity improves students' graph interpretation skills. Table 3 shows the comparison between pre- and post-test scores. The normalized gain score is calculated according to Equation 1 and is used to compare the pre- and post-test. Only one student's score decreases. The other 20 students improved their post-test scores with various normalized gains. Thirteen students obtained a high normalized gain, five students achieved a medium normalized gain, and one student achieved a low normalized gain. The class average for the pre- and post-test is shown in Table 4. Based on the average score, the average normalized gain is calculated as 0.74, which is categorized as a high normalized gain.
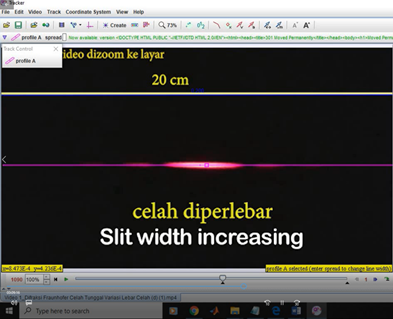
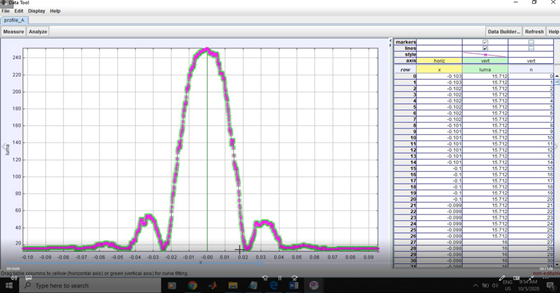
Figure-2. Analysis feature in Tracker can help students to look at the details of the experimental result and perform modelling.
Table-3. Comparison between individual pre-test and post-test scores.
Student |
Final Pre-test Score (max=100) |
Final Post-test Score (max=100) |
Individual
|
Criteria |
S1 |
0.00 |
60.00 |
0.60 |
medium |
S2 |
60.00 |
100.00 |
1.00 |
high |
S3 |
40.00 |
60.00 |
0.33 |
medium |
S4 |
0.00 |
100.00 |
1.00 |
high |
S5 |
20.00 |
80.00 |
0.75 |
high |
S6 |
40.00 |
20.00 |
-0.33 |
decrease |
S7 |
40.00 |
100.00 |
1.00 |
high |
S8 |
20.00 |
100.00 |
1.00 |
high |
S9 |
40.00 |
100.00 |
1.00 |
high |
S10 |
40.00 |
100.00 |
1.00 |
high |
S11 |
0.00 |
20.00 |
0.20 |
low |
S12 |
20.00 |
60.00 |
0.50 |
medium |
S13 |
0.00 |
100.00 |
1.00 |
high |
S14 |
40.00 |
100.00 |
1.00 |
high |
S15 |
0.00 |
40.00 |
0.40 |
medium |
S16 |
40.00 |
100.00 |
1.00 |
high |
S17 |
20.00 |
80.00 |
0.75 |
high |
S18 |
20.00 |
100.00 |
1.00 |
high |
S19 |
40.00 |
100.00 |
1.00 |
high |
S20 |
20.00 |
60.00 |
0.50 |
medium |
S21 |
0.00 |
100.00 |
1.00 |
high |
Table-4. Comparison between class average pre-test and post-test scores.
Average final pre-test core |
Average final post-test core |
Average |
Criteria |
23.81 |
80.00 |
0.74 |
High |
The pre- and post-test consisted of five questions. All the questions included indicators related to interpreting graphs. The average scores for each question are presented in Table 5. Although students had learned the theory of diffraction in a previous course, the pre-test score is still low. This indicates that students were not yet proficient in interpreting graphs. In general, the average score for each question improves in the post-test. Based on the calculated normalized gain, the scores for Q1 and Q3 moderately improve, while scores for Q2, Q4, and Q5 greatly improve.
Table-5. Comparison between the average class score for each question on the pre- and post-test.
| Question | Indicators | Pre-test Average (max=100) |
Post-test Average (max=100) |
Criteria |
|
Q1 |
Student can predict the light intensity pattern/graph in single slit diffraction for a certain experimental set-up | 9.5 |
71.4 |
0.68 |
medium |
Q2 |
Student can guess the experimental set-up in single slit diffraction based on the intensity graph interpretation | 19.0 |
81.0 |
0.76 |
high |
Q3 |
Student can predict the light intensity pattern/graph when the experiment parameter (slit width) in single slit diffraction is changed | 38.1 |
81.0 |
0.69 |
medium |
Q4 |
Student can predict the light intensity pattern/ graph when the experiment parameter (distance between slit and screen) in single slit diffraction is changed | 23.8 |
85.7 |
0.81 |
high |
Q5 |
Student can interpret the light wavelength used in the experiment based on the intensity graph | 28.6 |
81.0 |
0.73 |
high |
4.3. Students' Views on the Learning Activity
In addition to the test of their graph interpretation skills, a questionnaire of five Likert scale questions was given to students. Of the 21 participants, 15 participants filled in and submitted the questionnaires appropriately. The survey aims to collect the students' views on using Tracker for a modeling activity in the learning process. The results of the questionnaire are summarized in Table 6. The questionnaire's overall mean score is 4.1, which can be interpreted as high (Ibrahim & Bakar, 2015![]() ).
).
Table-6. Students' views on modeling activity using Tracker.
No. |
Statements | Strongly disagree (1) |
Disagree (2) |
Don't know (3) |
Agree (4) |
Strongly agree (5) |
Mean score |
|
1 |
The introduction given in the experiment video provides a clear explanation of the Fraunhofer-Diffraction experimental set-up | 1 (6.7%) |
0 (0%) |
1 (6.7%) |
3 (20%) |
10 (66.7%) |
4.4 |
|
2 |
Compared to observing a live demonstration and analyzing a set of data provided by the lecturer, the experiment video analysis activity using Tracker gave me a greater opportunity for learning | 0 (0%) |
1 (6.7%) |
2 (13.3%) |
4 (26.7%) |
8 (53.3%) |
4.3 |
|
3 |
I had the opportunity to learn analysis techniques for physics experiments through an activity using Tracker and Excel | 0 (0%) |
1 (6.7%) |
0 (0%) |
5 (33.3%) |
9 (60%) |
4.5 |
|
4 |
Analysis using Tracker and Excel helped me to interpret the experimental result | 0 (0%) |
1 (6.7%) |
0 (0%) |
7 (46.7%) |
7 (46.7%) |
4.3 |
|
5 |
I want to explore more physical phenomena using Tracker software | 1 (6.7%) |
0 (0%) |
1 (6.7%) |
9 (60%) |
4 (26.7%) |
4 |
|
6 |
The learning activity using Tracker improved my motivation to learn physics online | 1 (6.7%) |
0 (0%) |
2 (13.3%) |
8 (53.3%) |
4 (26.7%) |
3.9 |
|
7 |
Understanding how to use Tracker is easy | 0 (0%) |
1 (6.7%) |
3 (20%) |
9 (60%) |
2 (13.3%) |
3.8 |
|
8 |
The activity using Tracker and Excel helped me to connect theoretical models with experimental results | 1 (6.7%) |
0 (0%) |
1 (6.7%) |
9 (60%) |
4 (26.7%) |
4.0 |
|
9 |
The activity using Tracker helped me to interpret the physical meaning of a graph representation. | 1 (6.7%) |
0 (0%) |
1 (6.7%) |
7 (46.7%) |
6 (40%) |
4.1 |
|
Overall mean score |
4.1 | |||||||
Based on the survey, 80% of students agreed that modeling activity using Tracker in the Advance Physics Experiment course gave them a greater opportunity to learn than by simply observing live demonstrations and analyzing data provided by the lecturer. 93.3% of students also agreed that they could learn data analysis techniques through physics experiments. 93.3% of students thought Tracker and Excel, which were used during the learning activity, helped them interpret the experimental results. These results are in line with the improvement in graph interpretation skills.
Before this study was conducted, the online Advanced Physics Experiment course generally consisted of the lecturer giving a live demonstration via Zoom every week. Students then had to write an experiment report based on the lecturer's data. The modeling activity using Tracker was something new to the students. According to the survey, 73.3% of students felt that it was easy to understand how to use Tracker. Some of the students may have found it quite difficult because it was new to them. However, it did show positive effects on students' motivation; 80% of students stated that the activity improved their motivation for the online physics course, and 86.7% of students wanted to explore more physics phenomena using Tracker.
5. Conclusion
It has been challenging to teach physics and other science courses during the COVID-19 pandemic, especially when face-to-face laboratory-based courses have had to be transformed into online courses. In addition, maintaining students' learning motivation during an online course is not an easy task. Hence, when teaching online, educators need to implement innovative learning activities. In this study, we have demonstrated Tracker-assisted modeling activity, as implemented in the undergraduate Advanced Physics Experiment course. The results show that the learning activity effectively improves students' data skills, especially those related to graph interpretation; the normalized gain is 0.74, which can be categorized as high. This skill is important for preparing the future workforce. Moreover, students also stated that, using Tracker, they were more motivated to learn physics online and had more opportunities to learn during the modeling activity. In a future study, Tracker-assisted modeling activity might also be combined with simple experiment project that students can conduct at home.
Citation| Elisabeth Pratidhina; Dadan Rosana; Heru Kuswanto (2021). Implementation of a Tracker-Assisted Modeling Activity in an Online Advanced Physics Experiment Course. Journal of Education and e-Learning Research, 8(2): 222-229. |
References
Aguilar-Marin, P., Chaves-Bacilio, M., & Jáuregui-Rosas, S. (2018). Using analog instruments in Tracker video-based experiments for understanding electricity and magnetism phenomena in physics education. European Journal of Physics, 39(3), 035204. Available at: https://doi.org/10.1088/1361-6404/aaa8f8 .
Amaliah, N. U., Darmadi, I. W., & Saehana, S. (2020). Analysis of students’ understanding of motion concept with video based learning assisted by tracker software. Periodic Scientific Physics Education, 8(2), 126-132. Available at: https://doi.org/10.20527/bipf.v8i2.8369 .
Arribas, E., Escobar, I., & Suarez, C. P. (2015). Measurement of the magnetic field of small magnets with a smartphone: A very economical laboratory practice for introductory physics courses. European Journal of Physics, 36(6), 65002. Available at: https://doi.org/10.1088/0143-0807/36/6/065002 .
Aththibby, A. R., Kuswanto, H., & Mundilarto. (2021). Experiments in physics learning in the COVID-19 Era: Systematic literature review. Paper presented at the 7th International Conference on Research, Implementation, and Education of Mathematics and Sciences (ICRIEMS 2020). Atlantis Press.
Bayrak, C. (2008). Effects of computer simulations programs on university students’ achievments in physics. Turkish Online Journal of Distance Education, 9(4), 53–62.
Brewe, E. (2008). Modeling theory applied: Modeling Instruction in introductory physics Modeling theory applied: Modeling Instruction in introductory physics. American Journal of Physics, 76(12), 1155-1160. Available at: https://doi.org/10.1119/1.2983148 .
Brown, D. (2020). Tracker video analysis and modeling tool. Retrieved from https://physlets.org/tracker/ .
Brown, D., & Cox, A. J. (2009). Innovative uses of video analysis. The Physics Teacher, 47(3), 145-150. Available at: https://doi.org/10.1119/1.3081296 .
Buckley, B. C., & Boulter, C. J. (2000). Investigating the role of representations and expressed models in building mental models. In C. J. Boulter (Ed.), Developing Models in Science Education (pp. 119–135). Dordrecht: Springer.
Campari, E. G., Barbetta, M., Braibant, S., Cuzzuol, N., Gesuato, A., Maggiore, L., & Vignali, C. (2021). Physics laboratory at home during the COVID-19 pandemic. The Physics Teacher, 59(1), 68-71.
Cascarosa, E., Sánchez-Azqueta, C., Gimeno, C., & Aldea, C. (2020). Model-based teaching of physics in higher education: A review of educational strategies and cognitive improvements. Journal of Applied Research in Higher Education, 13(1), 33-47. Available at: https://doi.org/10.1108/JARHE-11-2019-0287.
Castaneda, A. (2019). Rectilinear movement and functions through the analysis of videos with Tracker. The Physics Teacher, 57(7), 506-507. Available at: https://doi.org/10.1119/1.5126842 .
Develaki, M. (2017). Using computer simulations for promoting model-based reasoning. Science & Education, 26(7), 1001-1027. Available at: https://doi.org/10.1007/s11191-017-9944-9 .
Eadkhong, T., Rajsadorn, R., Jannual, P., & Danworaphong, S. (2012). Rotational dynamics with Tracker. European Journal of Physics, 33, 615–622. Available at: https://doi.org/10.1088/0143-0807/33/3/615 .
Eddy, Y. (2016). Using tracker to engage students’ learning and research in physics. Pertanika Journal of Science and Technology, 24(2), 483-491.
Ergül, N. R. (2018). Pre-service science teachers' construction and interpretation of graphs. Universal Journal of Educational Research, 6(1), 139-144. Available at: https://doi.org/10.13189/ujer.2018.060113 .
Glazer, N. (2015). Studies in science education challenges with graph interpretation: A review of the literature. Studies in Science Education, 7267(December), 183–210. Available at: https://doi.org/10.1080/03057267.2011.605307 .
Habibi, H., Jumadi, J., & Mundilarto, M. (2020). PhET simulation as means to trigger the creative thinking skills of physics concepts. International Journal of Emerging Technologies in Learning, 15(6), 166-172. Available at: https://doi.org/10.3991/ijet.v15i06.11319 .
Hake, R. R. (1998). Interactive-engagement versus traditional methods: A six-thousand-student survey of mechanics test data for introductory physics courses. American Journal of Physics, 66(1), 64–74. Available at: https://doi.org/10.1119/1.18809 .
Halloun, I. A. (2007). Mediated modeling in science education. Science & Education, 16, 653–697. Available at: https://doi.org/10.1007/s11191-006-9004-3 .
Hestenes, D. (1997). Modeling methodology for physics teachers. AIP Conference Proceedings, 399(935). Available at: https://doi.org/10.1063/1.53196 .
Hockicko, P., Krišták, L., & Miroslav, N. (2015). Development of students’ conceptual thinking by means of video analysis and interactive simulations at technical universities. European Journal of Engineering Education, 40(2), 37–41. Available at: https://doi.org/10.1080/03043797.2014.941337 .
Hoyer, C., & Girwidz, R. (2018). A remote lab for measuring, visualizing and analysing the field of a cylindrical permanent magnet A remote lab for measuring, visualizing and analysing the field of a cylindrical permanent magnet. European Journal of Physics, 39, 065808. Available at: https://doi.org/10.1088/1361-6404/aae35a .
Ibrahim, W. N. A., & Bakar, A. (2015). Impact of entrepreneurship education on the entrepreneurial intentions of students in technical and vocational education and training institutions (TVET) in Malaysia. International Education Studies, 8(12), 141-156. Available at: https://doi.org/10.5539/ies.v8n12p141 .
Kestin, G., Miller, K., Mccarty, L. S., Callaghan, K., & Deslauriers, L. (2020). Comparing the effectiveness of online versus live lecture demonstrations. Physical Review Physics Education Research, 16(1), 13101. Available at: https://doi.org/10.1103/PhysRevPhysEducRes.16.013101 .
Kinchin, J. (2016). Using Tracker to prove the simple harmonic motion equation. Physics Education, 51(5), 053003. Available at: https://doi.org/10.1088/0031-9120/51/5/053003 .
Pili, U., & Violanda, R. (2018). A simple pendulum-based measurement of g with a smartphone light sensor. Physics Education, 53, 043001. Available at: https://doi.org/10.1088/1361-6552/aaab9c .
Pols, F. (2020). A physics lab course in times of COVID-19. Electronic Journal for Research in Science & Mathematics Education, 24(2), 172-178.
Pospiech, G. (2019). Framework of mathematization in physics from a teaching perspective. In G. Pospiech, M. Michelini, & B.-S. Eylon (Eds.), Mathematics in Physics Education (pp. 1–29). Switzerland: Springer Nature Switzerland.
Pratama, H., Azman, M. N. A., Kassymova, G. K., & Duisenbayeva, S. S. (2020). The trend in using online meeting applications for learning during the period of pandemic COVID-19 : A literature review. Journal of Innovation in Educational and Cultural Research, 1(2), 58-68. Available at: https://doi.org/10.46843/jiecr.v1i2.15 .
Pratidhina, E., Pujianto, & Sumardi, Y. (2019). Developing computer program as a learning resource on gas law topics for high school students. International Journal of Instruction, 12(2), 133–146. Available at: https://doi.org/10.29333/iji.2019.1229a .
Pratidhina, E., Dwandaru, W. S. B., & Kuswanto, H. (2020). Exploring Fraunhofer diffraction through Tracker and spreadsheet: An alternative lab activity for distance learning. Mexican Journal of Physics E, 17(2 Jul-Dec), 285-290. Available at: https://doi.org/10.31349/revmexfise.17.285 .
Rodrigues, M., Marques, M. B., & Sime, P. (2016). How to build a low cost spectrometer with Tracker for teaching light spectra. Physics Education, 51, 014002. Available at: https://doi.org/10.1088/0031-9120/51/1/014002 .
Rodrigues, M., & Carvalho, P. S. (2014). Teaching optical phenomena with tracker. Physics Education, 49(6), 671-677. Available at: https://doi.org/10.1088/0031-9120/49/6/671 .
Sadoglu, G. P., & Durukan, U. G. (2018). Determining the perceptions of teacher candidates on the concepts of science course, science laboratory, science teacher and science student via metaphors. International Journal of Research in Education and Science, 4(2), 436-453.
Shurygin, V., & Sabirova, F. (2017). Particularities of blended learning implementation in teaching physics by means of LMS Moodle. Espacios, 38(40), 39-39.
Stefanel, A. (2019). Graph in physics education: From representation to conceptual understanding. In G. Pospiech, M. Michelini, & B.-S. Eylon (Eds.), Mathematics in Physics Education (pp. 195–229). Switzerland: Springer Nature Switzerland.
Trocaru, S., Berlic, C., Miron, C., & Barna, V. (2020). Using tracker as video analysis and augmented reality tool for investigation of the oscillations for coupled pendula. Romanian Reports in Physics, 72(902), 1-16.
Ürek, H., Özdemir, E., & Coramik, M. (2021). Using Tracker to find the minimum angle of deviation and the refractive index of a prism. Physics Education, 56(3), 035016. Available at: https://doi.org/10.1088/1361-6552/abe3cb .
Wang, J., Jou, M., Lv, Y., & Huang, C. (2018). An investigation on teaching performances of model-based flipping classroom for physics supported by modern teaching technologies. Computers in Human Behavior, 84, 36–48. Available at: https://doi.org/10.1016/j.chb.2018.02.018 .
Wee, L. K., Tan, K. K., & Leong, T. K. (2015). Using tracker to understand‘ toss up’ and free fall motion: A case study. Physics Education, 50(4), 436–442. Available at: https://doi.org/10.1088/0031-9120/50/4/436 .
Wee, L. K., Chew, C., Goh, G. H., Tan, S., & Lee, T. L. (2012). Using tracker as a pedagogical tool for understanding projectile motion. Physics Education, 47(4), 448–455. Available at: https://doi.org/10.1088/0031-9120/47/4/448.
| Asian Online Journal Publishing Group is not responsible or answerable for any loss, damage or liability, etc. caused in relation to/arising out of the use of the content. Any queries should be directed to the corresponding author of the article. |