Applying Explainable Artificial Intelligence to Develop a Model for Predicting the Supply and Demand of Teachers by Region
Graduate School of Education, Seoul National University of Education, South Korea.
Abstract
Among various methods to improve educational conditions, efforts are being made to reduce the number of students per teacher. However, for policy decisions it is necessary to reflect multiple factors such as changes in the number of students over time and local requirements. Time-series analysis-based statistical models have been used as a method to inform policy decisions. However, the existing statistical models are linear and the accuracy of their predictions is inferior. Also, since there are both internal and external factors that influence the number of students and thus the prediction of the number of required teachers, it is necessary to develop a model that reflects this. Therefore, in this study, an artificial intelligence model based on machine learning was developed using the XGBoost technique, and feature importance, partial dependence plot, and Shap Value were used to increase the model's explanatory potential. The model showed a performance of less than 0.03 RMSE, and it was confirmed that among several factors the economically active population had the most significant effect on the number of teachers. Through this study, it was possible to examine the applicability of an artificial intelligence model with improved explanatory possibilities in predicting the number of teachers.
Keywords:Teacher supply, Demand prediction, Artificial intelligence model development, XGBoost, XAI, SHAP.
Contribution of this paper to the literature: The current study can be distinguished from other studies in that it predicts the number of teachers using machine learning techniques. In particular, it is essential to discover the factors that influence the number of teachers using XAI. This study uses data provided by South Korea's national public data portal, such as fertility rate, population movement, number of students, and economically active population to predict the number of teachers. It is expected that this study will be able to help to develop a supply and demand policy for teachers, using artificial intelligence techniques.
1. Introduction
To effectively carry out learning activities, it is necessary to ensure sufficient educational facilities and efficiently utilize human resources such as teachers. In South Korea, the number of students per teacher and the number of students per class is continuously decreasing through the increasing number of teachers, schools, and classes. As of 2020, however, the number of students per teacher in elementary schools is 23.1. This is higher than the OECD average of 21.1 (OECD, 2021![]() ). Another factor that must be taken into account is that Korea is experiencing a rapid population decline, and, as of 2020, the total fertility rate of women of childbearing potential is only 0.84, which is the lowest among the OECD countries (OECD, 2021
). Another factor that must be taken into account is that Korea is experiencing a rapid population decline, and, as of 2020, the total fertility rate of women of childbearing potential is only 0.84, which is the lowest among the OECD countries (OECD, 2021![]() ). The method of recruiting additional teachers to reduce the number of students per teacher must thus be balanced with various factors, including a sudden decrease in the number of students in the future. Future prediction in the field of social science is mainly carried out by means of time series analysis models or statistical models. This entails searching for an appropriate model based on past data. However, since the time series analysis model assumes a linear progression, the problem is that it is unrealistic, and its prediction efficiency is inferior (Sejong & Hyungjun, 2020
). The method of recruiting additional teachers to reduce the number of students per teacher must thus be balanced with various factors, including a sudden decrease in the number of students in the future. Future prediction in the field of social science is mainly carried out by means of time series analysis models or statistical models. This entails searching for an appropriate model based on past data. However, since the time series analysis model assumes a linear progression, the problem is that it is unrealistic, and its prediction efficiency is inferior (Sejong & Hyungjun, 2020![]() ). Recently, the machine learning technique, a nonlinear estimation technique, has achieved highly promising research results in classification and regression. Artificial intelligence developed using machine learning techniques has an excellent ability to draw conclusions by analyzing patterns in data. Its disadvantage, however, is that it is less able to explain the decision-making process that led it to draw a specific conclusion. For this reason, it is also called a black-box model. To solve this problem, XAI (eXplainable Artificial Intelligence), a technique that adds explainability to artificial intelligence models, has been introduced as a way to solve the complexity of machine learning models (Gunning & Aha, 2019
). Recently, the machine learning technique, a nonlinear estimation technique, has achieved highly promising research results in classification and regression. Artificial intelligence developed using machine learning techniques has an excellent ability to draw conclusions by analyzing patterns in data. Its disadvantage, however, is that it is less able to explain the decision-making process that led it to draw a specific conclusion. For this reason, it is also called a black-box model. To solve this problem, XAI (eXplainable Artificial Intelligence), a technique that adds explainability to artificial intelligence models, has been introduced as a way to solve the complexity of machine learning models (Gunning & Aha, 2019![]() ). Accordingly, this study aims to develop a machine learning-based model, in contrast to the existing time series analysis model, as a model to predict the number of teachers required in the future. Further, by adding explanatory possibilities to the machine learning model, various variables affecting the supply and demand of teachers are identified using feature importance, partial dependence plots, and SHAP techniques.
). Accordingly, this study aims to develop a machine learning-based model, in contrast to the existing time series analysis model, as a model to predict the number of teachers required in the future. Further, by adding explanatory possibilities to the machine learning model, various variables affecting the supply and demand of teachers are identified using feature importance, partial dependence plots, and SHAP techniques.
In this was, the intention is to confirm the applicability of the machine learning technique to the regional teacher supply and demand prediction model and analyze the factors that affect the supply and demand of teachers.
2. Related Research
Historically, research on the prediction of teacher supply and demand has been based on prediction by means of the autoregressive integrated moving average (ARIMA) model, based on the time series regression model; the FORECAST estimation method, based on the step-by-step automatic regression model; and the exponential smoothing method. However, the estimation through statistical methods is considered to have limitations when there are no specific rules in the past data or when the decisive variable changes in the future. It was determined that a statistical estimation of the supply and demand of teachers was likely to lead to errors. The estimation of the supply and demand of teachers is also highly likely to have a policy variable that differs from the variables used in the estimation of population growth. Also, statistical techniques have a limitation when specific events in the future may be involved in predicting the supply and demand of human resources, which may disturb the prediction function. This limitation is particularly relevant in the estimation of the human resource field, in which various such events may occur. The premised analysis method was thus considered necessary (Kwon & Ahn, 2018![]() ).
).
To overcome the limitations of this statistical technique, a study was conducted that applied a method extending from the existing statistical technique. Young, Yookyung, and Leekyung (2013![]() ) conducted a study on the direction of teacher supply and demand policy based on an estimation of the number of future students and teachers in elementary and secondary school. In this study, scenario analysis was used to try to overcome the limitations of the existing statistical method, based on the estimation of the number of students, and to reflect the differences in student dynamics and distribution by region and school. To this end, the study incorporated significant policy variables affecting the future population estimates of the National Statistical Office, the number of populations by region, age, school, and future teacher demand for resident registration. The data related to the supply and demand of teachers used in this research were estimated based on the number of students and teachers in each provincial office of education or graduates from the college of education. At this time, significant statistical education data relating to elementary schools were used, and estimates were made using the number of schools, classes, students, and teachers, and the education budget provided by the education statistics service. In short, the data used in the research to predict the number of teachers made use of the data on the existing number of students and teachers. However, Kwon and Ahn (2018
) conducted a study on the direction of teacher supply and demand policy based on an estimation of the number of future students and teachers in elementary and secondary school. In this study, scenario analysis was used to try to overcome the limitations of the existing statistical method, based on the estimation of the number of students, and to reflect the differences in student dynamics and distribution by region and school. To this end, the study incorporated significant policy variables affecting the future population estimates of the National Statistical Office, the number of populations by region, age, school, and future teacher demand for resident registration. The data related to the supply and demand of teachers used in this research were estimated based on the number of students and teachers in each provincial office of education or graduates from the college of education. At this time, significant statistical education data relating to elementary schools were used, and estimates were made using the number of schools, classes, students, and teachers, and the education budget provided by the education statistics service. In short, the data used in the research to predict the number of teachers made use of the data on the existing number of students and teachers. However, Kwon and Ahn (2018![]() ) observed that the number of students and teachers might change according to specific external environmental variables, so it became clear that a study must be conducted that takes this into account. Kwon and Ahn (2018
) observed that the number of students and teachers might change according to specific external environmental variables, so it became clear that a study must be conducted that takes this into account. Kwon and Ahn (2018![]() ) developed a simulation model to predict the supply and demand of elementary school teachers and conducted a study to obtain the implications for the process of policymaking with regards to the supply and demand of teachers by reviewing its validity. In this study, a simulation model for predicting the supply and demand of elementary school teachers was constructed using the URBAN1 model from the field of system dynamics; the parameter values of the model were statistical data concerning industry, population, housing, land, and education in the K province in 2000. Elementary schools were modeled assuming that the population transfer in and out of the area was affected by the current industry and housing conditions in the area. The result was an R-squared value of 0.76, meaning that the correspondence between the predicted value and the measured value was 76%. This supports the argument that changes in socio-economic conditions affect the number of elementary schools and, to some extent, the number of teachers in the region. Since the number of schools and teachers in the region are therefore affected by factors external to education, it is necessary to predict teachers' supply and demand using data that includes changes in various socio-economic conditions. The existing statistical techniques are limited in that they cannot take social changes into account because they estimate the number of future students and teachers based purely on population estimates.
) developed a simulation model to predict the supply and demand of elementary school teachers and conducted a study to obtain the implications for the process of policymaking with regards to the supply and demand of teachers by reviewing its validity. In this study, a simulation model for predicting the supply and demand of elementary school teachers was constructed using the URBAN1 model from the field of system dynamics; the parameter values of the model were statistical data concerning industry, population, housing, land, and education in the K province in 2000. Elementary schools were modeled assuming that the population transfer in and out of the area was affected by the current industry and housing conditions in the area. The result was an R-squared value of 0.76, meaning that the correspondence between the predicted value and the measured value was 76%. This supports the argument that changes in socio-economic conditions affect the number of elementary schools and, to some extent, the number of teachers in the region. Since the number of schools and teachers in the region are therefore affected by factors external to education, it is necessary to predict teachers' supply and demand using data that includes changes in various socio-economic conditions. The existing statistical techniques are limited in that they cannot take social changes into account because they estimate the number of future students and teachers based purely on population estimates.
3. Research Method
A. XGBoost
In this study, the XGBoost algorithm, a tree-based ensemble learning method, was used to create a tree for regression and perform regression prediction by developing an artificial intelligence model to predict teacher supply and demand. The tree structure is an algorithm used in both classification and regression methods. Unlike the classification tree that determines a specific class label, the regression tree is characterized by its calculation of the regression prediction value by obtaining the average data values belonging to each leaf node (Albon, 2018![]() ). Deep learning techniques, which have recently attracted attention, show high performance in the unstructured data domain, but the ensemble method shows very high prediction performance in the domain of predictive analysis of structured data (Albon, 2018
). Deep learning techniques, which have recently attracted attention, show high performance in the unstructured data domain, but the ensemble method shows very high prediction performance in the domain of predictive analysis of structured data (Albon, 2018![]() ). The ensemble method improves prediction performance by performing probabilistic supplementation of the result by combining learning algorithms with relatively poor prediction performance and carrying out corrections through weight updates where prediction errors occur. In the ensemble technique, learning is performed sequentially through several classifiers, and if the prediction of a previously learned classifier is wrong, the next classifier is given a weight to perform learning and prediction. In this way, the weight given to each classifier is continually boosted. In terms of execution time, XgBoosting (eXtra Gradient Boosting) is an improved algorithm compared to the gradient boosting method that was mainly used in the past (Chen et al., 2015
). The ensemble method improves prediction performance by performing probabilistic supplementation of the result by combining learning algorithms with relatively poor prediction performance and carrying out corrections through weight updates where prediction errors occur. In the ensemble technique, learning is performed sequentially through several classifiers, and if the prediction of a previously learned classifier is wrong, the next classifier is given a weight to perform learning and prediction. In this way, the weight given to each classifier is continually boosted. In terms of execution time, XgBoosting (eXtra Gradient Boosting) is an improved algorithm compared to the gradient boosting method that was mainly used in the past (Chen et al., 2015![]() ). Although XGBoost is based on GBM (Gradient Boosting), it can complete learning faster than the existing GBM and has demonstrated excellent predictive performance, so it is gaining attention in tree-based ensemble learning. Furthermore, the XGBoost algorithm is a technique with high explanatory potential. The decision tree is an essential factor with a high impact on the model's performance, in which an attribute is selected as a rule condition based on uniformity. Some of these essential features significantly contribute to the creation of a clear rule tree. In general, whereas other machine learning algorithms are called black boxes and feature complex operation principles within the algorithm, the decision tree can visually express the elements related to the algorithm because the algorithm itself is intuitive.
). Although XGBoost is based on GBM (Gradient Boosting), it can complete learning faster than the existing GBM and has demonstrated excellent predictive performance, so it is gaining attention in tree-based ensemble learning. Furthermore, the XGBoost algorithm is a technique with high explanatory potential. The decision tree is an essential factor with a high impact on the model's performance, in which an attribute is selected as a rule condition based on uniformity. Some of these essential features significantly contribute to the creation of a clear rule tree. In general, whereas other machine learning algorithms are called black boxes and feature complex operation principles within the algorithm, the decision tree can visually express the elements related to the algorithm because the algorithm itself is intuitive.
B. XAI
Artificial intelligence models, like black boxes, do not reveal much about their judgment process. This has led artificial intelligence models to be characterized by poor reliability and rationality. The eXplainable Artificial Intelligence (XAI) technique improves the explainability of the inference process (Gunning, 2017![]() ). As such, XAI techniques allow AI models to know what processes and grounds exist when they draw specific conclusions. Due to the significant increase in the amount of data used to train machines through machine learning, which is used as the primary method of developing artificial intelligence, and the decision branch of machine learning models, XAI techniques are mainly used both to reduce complexity and at the same time increase model reliability. These techniques include Feature Importance, Partial Depends Plots, and SHAP(SHapley Additive exPlanations).
). As such, XAI techniques allow AI models to know what processes and grounds exist when they draw specific conclusions. Due to the significant increase in the amount of data used to train machines through machine learning, which is used as the primary method of developing artificial intelligence, and the decision branch of machine learning models, XAI techniques are mainly used both to reduce complexity and at the same time increase model reliability. These techniques include Feature Importance, Partial Depends Plots, and SHAP(SHapley Additive exPlanations).
3.1. Feature Importance
The XAI techniques include feature importance, which describes the importance of each feature used to develop an artificial intelligence model. Feature importance techniques are the method of identifying the most critical features, which have the highest impact on the prediction of the result when a particular variable is placed in an artificial intelligence model (Altmann, Toloşi, Sander, & Lengauer, 2010![]() ). This method is characterized by permutation, which is used to examine the error value or influence on predictions that occurs when a particular feature's value is arbitrarily changed. Feature importance does not cover variables with increasing error, because the model intentionally ignores learning for negative features. Therefore, no matter which features harm housing prices, for instance, the importance of the feature is not reflected. For this reason, the critical technique of a particular feature can be valued higher than its actual influence. Despite these drawbacks, however, feature importance is easy to measure and simple to incorporate in the algorithm, so it is used to understand the model.
). This method is characterized by permutation, which is used to examine the error value or influence on predictions that occurs when a particular feature's value is arbitrarily changed. Feature importance does not cover variables with increasing error, because the model intentionally ignores learning for negative features. Therefore, no matter which features harm housing prices, for instance, the importance of the feature is not reflected. For this reason, the critical technique of a particular feature can be valued higher than its actual influence. Despite these drawbacks, however, feature importance is easy to measure and simple to incorporate in the algorithm, so it is used to understand the model.
3.2. Partial Depends Plots
Partial Depends Plot (PDP) is a method of observing how much algorithmic interpretability increases or decreases when linearly altering the feature's figures (Greenwell, 2017![]() ). It is one of the techniques used in XAI because it can be used to demonstrate how the feature's numerical changes contribute to the model. This technique is characterized by a visible understanding of the model's effect when the values of the features change. Feature importance does not allow for a determination of whether the feature positively or negatively affects the model's judgment. However, when a partial dependency plot is used, it becomes clear whether each feature has a positive or negative effect on the model and to what extent there may be errors in an environment that does not guarantee independence. This allows the causes of distortion of conclusions due to specific biased data to be identified when training artificial intelligence models.
). It is one of the techniques used in XAI because it can be used to demonstrate how the feature's numerical changes contribute to the model. This technique is characterized by a visible understanding of the model's effect when the values of the features change. Feature importance does not allow for a determination of whether the feature positively or negatively affects the model's judgment. However, when a partial dependency plot is used, it becomes clear whether each feature has a positive or negative effect on the model and to what extent there may be errors in an environment that does not guarantee independence. This allows the causes of distortion of conclusions due to specific biased data to be identified when training artificial intelligence models.
3.3. Shapley Additive Explanations
Although there are similarities between SHAP and feature importance, SHAP has the advantage of being able to compute each feature’s influence on the model, including its dependence on other features. SHAP is a technique for analyzing how much each feature affects the model based on the independence between the Shapley value and the features (Parsa, Movahedi, Taghipour, Derrible, & Mohammadian, 2020![]() ). The Shapley value represents the contribution of each feature, expressed in positive and negative numbers. If the Shapley value is negative, it illustrates that the feature harms the predictive power of the model. A feature of SHAP is that using these Shapley values the same results are output at each calculation, and SHAP does consider the negative influences that feature importance does not take into account. Moreover, it offers the advantage that one or more essential features can be computed (Lundberg & Lee, 2017
). The Shapley value represents the contribution of each feature, expressed in positive and negative numbers. If the Shapley value is negative, it illustrates that the feature harms the predictive power of the model. A feature of SHAP is that using these Shapley values the same results are output at each calculation, and SHAP does consider the negative influences that feature importance does not take into account. Moreover, it offers the advantage that one or more essential features can be computed (Lundberg & Lee, 2017![]() ). However, the Shapley values take into account the possibility that the features will affect each other. Shapley values thus allow for the dependence between features and calculate the negative influence. Thus, by using the Shapley value a wide range of pitfalls can be avoided that the use of feature importance does not guarantee.
). However, the Shapley values take into account the possibility that the features will affect each other. Shapley values thus allow for the dependence between features and calculate the negative influence. Thus, by using the Shapley value a wide range of pitfalls can be avoided that the use of feature importance does not guarantee.
C. Data Used
This study was conducted using the Public Data Portal. The data used are specified as follows. First of all, NES (Number of Elementary Student), NET (Number of Elementary Teacher), and NEC (Number of Elementary Class) data are basic education statistics made available by the South Korea Educational Development Institute. The basic statistics on education provide data on the number of schools, classes, and teachers for each of the 17 cities and provinces from 1999 to 2020. Next, the source of fertility data (FR) used in the study was the census run by the National Statistical Office. The Population Trend Survey offers data that identifies the numbers of births, deaths, marriages, and divorces, which are fundamental factors that change the size and structure of the South Korean population. The sources of economically active population data (EAP) used in the study are the economically active population surveys carried out by the National Statistical Office. Economic activists aim to provide basic data necessary for macroeconomic analysis and the development of policies regarding manpower resources by examining the characteristics of the population’s economic activities (employment, unemployment, labor, etc.). This data is presented quarterly for 17 cities and provinces from the third quarter of 1999 to the fourth quarter of 2020. The origin of the population movement data (PM) used in the study is the national population movement statistics offered by the National Statistical Office. The purpose of these statistics is to periodically identify trends in population movement and utilize these as basic data to develop population policy and balance regional development. Data are presented on a monthly basis from January 2001 to December 2020, covering 17 cities and provinces and representing the number of people transferred, the net movement, and movement rates. This study used data from 2001 to 2019 to match the time points of the available data, and presented data separately for each city and province. Also, to improve the performance of the artificial intelligence models, the data was normalized to values between 0 and 1.
4. Model Development
In this study, we used XGBoost, among the various machine learning techniques, to develop an artificial intelligence model to predict the number of required teachers. Five data attributes were used to develop the model: birth rate by city, economically active population by city, population movement count by city, number of school-age students by city, number of elementary school classes by city, and number of elementary school teachers.
Regression analysis was performed using XGBoost, and RMSE values were derived from measurements of the model's accuracy. The RMSE value was 0.003, indicating a high level of accuracy.
A. Apply Feature Importance
Feature importance is a technique used to analyze to what extent each data feature affects the model's exact prediction. The results of the application of this technique are shown in Figure 1.
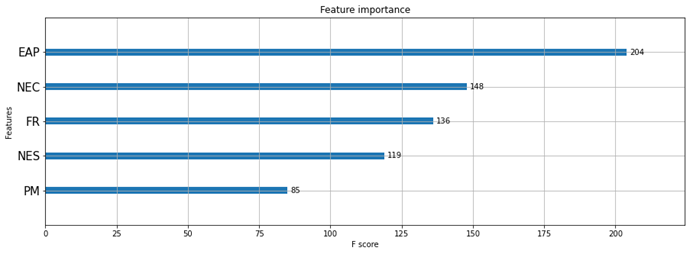
Figure-1. Feature importance of teacher prediction artificial intelligence model.
According to the application of feature importance to the teacher prediction artificial intelligence model, the factors that affect the prediction of the artificial intelligence model are economically active population by city, number of elementary school classrooms by city, birth rate by city, number of students by city, and population migration.
B. Apply Partial Dependency Plot
Partial dependency plots are a XAI technique that shows how the degree of contribution a feature makes to the model depends on the numerical changes in the feature.
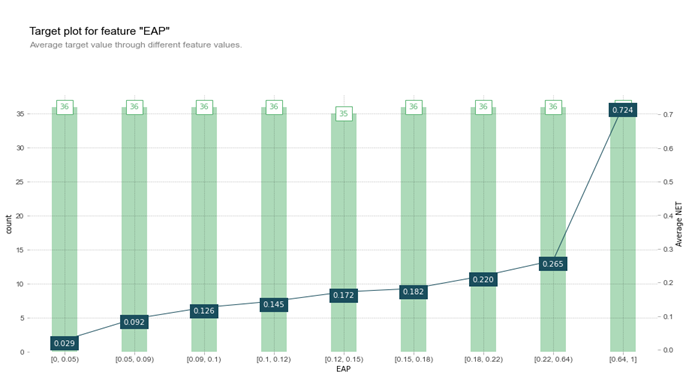
Figure-2. Target plot for economically active population feature.
Figure 2 shows a target plot of how the economically active population affects the required number of teachers. In the graph, the x-axis represents the economically active population, the y-axis on the left the data count per section, and the y-axis on the right the number of teachers. The bar graph corresponds to the left y-axis, and the line graph corresponds to the right y-axis. The data count in the interval between 0 and 0.05 is 36. This corresponds to a required teacher number of 0.029. The data count in the interval between 0.64 and 1 in the economically active population is also 36, and the required number of teachers is 0.724. The shape of the line graph shows an upward tendency as the economically active population increases, which can thus be judged to have a high impact on the required number of teachers.
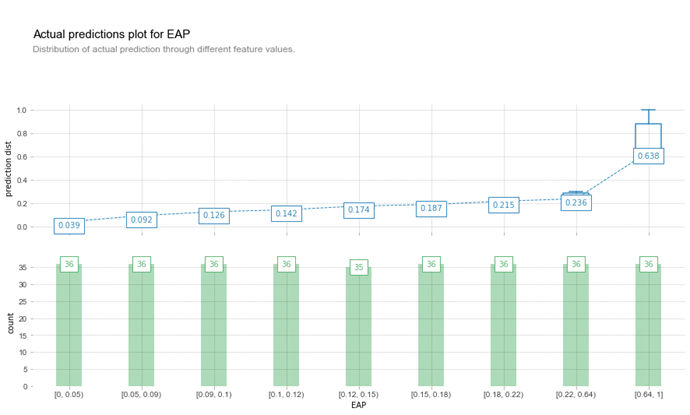
Figure-3. Results of predicting the number of teachers according to the economically active population feature.
Figure 3 shows a graph that combines data and models to see if the actual results match. The graph is in the form of candlestick charts. An artificial intelligence model developed according to the economically active population in each section resulted in the value 0.638, but the actual value is 0.724. This confirms that the economically active population in the section has a negative correlation in predicting the number of teachers.
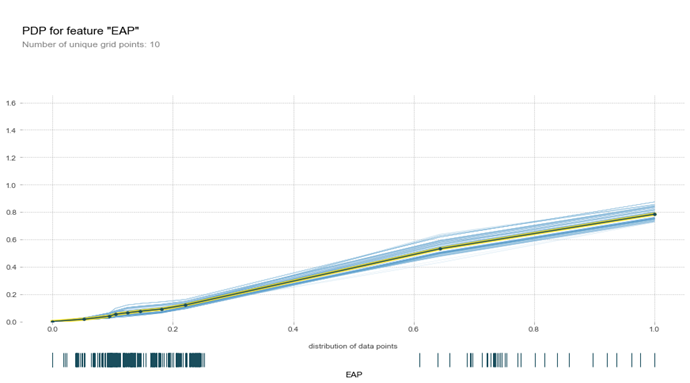
Figure-4. Partial dependence plot for the predicted number of teachers for the economically active population feature.
Figure 4 is the result of calculating the partial dependence value for a specific feature. Again, as the value of the economically active population feature increases, the predicted value of the number of teachers also increases.
C. Apply SHAP
The SHAP algorithm was then applied to the model developed using XGBoost. To show the result of SHAP, a JavaScript visualization library was used, and the output form of the Shapley value was visualized in the form of an ensemble tree.
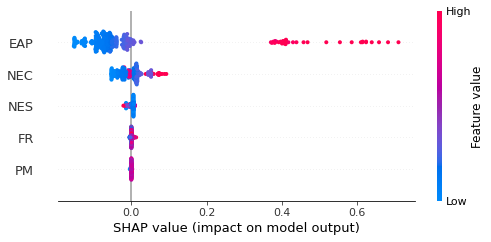
Figure-5. Shapley values by feature.
Figure 5 depicts a graph showing how the various features affect the number of teachers. In Figure 5, a red dot means that the row feature corresponding to the point has a great influence on determining the number of teachers, and a blue dot means that the row feature has a negligible effect on determining the number of teachers. As can be seen from the graph, the economically active population and the number of classrooms show a marked variance, whereas the variance is slight with regards to the number of students, birth rate, and population movement. It can be concluded that the economically active population and the number of classrooms play significant roles in determining the number of teachers.
Next, Figure 6 shows the Shapley value of the result of using the model to predict the number of teachers in Seoul in 2019. At this time, the number of teachers is estimated to be 0.62, and this value is very similar to the actual value of 0.60. Again, the factor that positively influenced the estimation of the number of teachers was the economically active population (EAP).
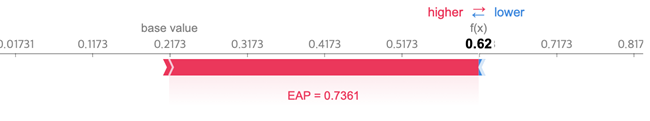
Figure-6. SHAP value of the result of predicting the number of teachers in Seoul in 2019.
Figure 7 depicts the result of arranging the Shapley values for the prediction of the number of teachers in Gangwon-do in 2019 on a one-dimensional plane. As shown in Figure 7, the model estimates the number of teachers as 0.14, and this value is very similar to the actual value of 0.142. In this case, the factor that most negatively influenced the estimate of the number of teachers was the economically active population (EAP). In addition, the number of students (NES) was a factor that positively influenced the estimation of the number of teachers.
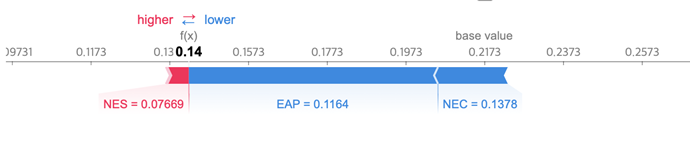
Figure-7. SHAP value for the prediction of the number of teachers in Gangwon-do in 2019.
Figure 8 is the result of accumulating and loading Shapley's influence on all data. As a result of the vertical accumulation of data such as that in Figure 6 the vertical accumulation of the entire dataset can be depicted. As can be seen from the form of the graph, the economically active population (EAP) was the factor that had the most influence on the artificial intelligence model’s predictions of the number of teachers. The lower the value of the economically active population, the lower the number of teachers predicted, and the higher the value, the higher the number of teachers predicted.
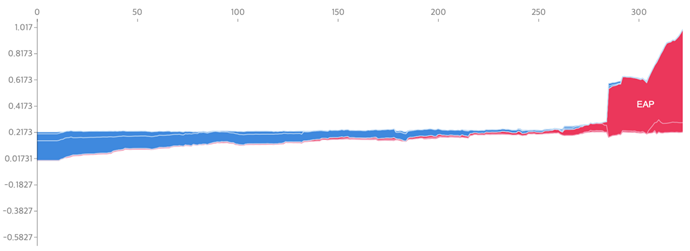
Figure-8. The result of filtering the correlation between the economically active population and the number of teachers according to Shapley's influence on the total data.
Figure 9 is the result of filtering the correlation between the economically active population and the number of teachers according to Shapley's influence on the total data. As can be seen from the graph, as the value of the economically active population increases beyond 0.24, the number of teachers is higher than average, and when it is smaller, the number of teachers is lower than average.
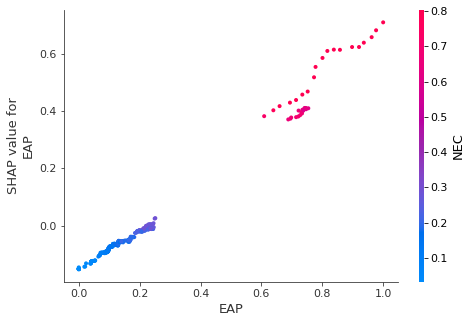
Figure-9. Correlation of SHAP value between the economically active population and the number of teachers.
5. Conclusion
This study developed a model to predict the supply and demand of teachers by region by applying machine learning techniques and examining the factors affecting this supply and demand by region by applying explainable artificial intelligence techniques. The results of this study are as follows.
First, an artificial intelligence model to predict the supply and demand of teachers by region was developed using the XGBoost algorithm, a tree-based ensemble learning method. The existing statistical model for time series analysis is linear, therefore offering inferior prediction efficiency, but the XGBoost algorithm showed an error of less than RMSE 0.003. This indicates that the number of teachers in each region can be predicted with a high level of accuracy.
Second, the current time series-based supply and demand prediction model for teachers was developed based on purely educational factors, such as the number of students and the number of teachers. However, since the factors affecting the necessary number of teachers also include external factors, such as changes in various socio-economic conditions, it is necessary to develop an artificial intelligence model that takes these factors into account. Therefore, in this study, an artificial intelligence model was developed using data related to the number of schools, classes, teachers, birth population, economically active population, and population movement in each region provided by the South Korean public data portal.
Third, by adding explainability to the artificial intelligence model, the specific features that influence the model's prediction were identified. Feature importance, partial dependence plots, and SHAP were used to achieve explainability. As a result of applying all three techniques, the factor that was identified as having the most significant influence on predicting the number of teachers was the economically active population. This proves that the size of the economically active population in each region is an essential factor in predicting the number of teachers.
In this study, we developed an artificial intelligence that can predict the number of teachers in each region based on data from the previous ten years. The data used in the study were selected based on the factors judged to be meaningful in previous studies, but various other factors may have an impact. Accordingly, there is a need for further research on the factors not presented in this study and the development of artificial intelligence models.
CitationCitation | Youngho Lee (2021). By Applying Explainable Artificial Intelligence Developing a Model for Predicting the Supply and Demand of Teachers by Region. Journal of Education and e-Learning Research, 8(2): 198-205. |
References
Albon, C. (2018). Machine learning with python cookbook: Practical solutions from preprocessing to deep learning. In Machine learning with Python cookbook: Practical solutions from preprocessing to deep learning (pp. 233-240). Sebastopol, CA: O'Reilly Media.
Altmann, A., Toloşi, L., Sander, O., & Lengauer, T. (2010). Permutation importance: A corrected feature importance measure. Bioinformatics, 26(10), 1340-1347.
Chen, T., He, T., Benesty, M., Khotilovich, V., Tang, Y., & Cho, H. (2015). Xgboost: Extreme gradient boosting. R Package Version 0.4-2, 1-4.
Greenwell, B. M. (2017). Pdp: An R package for constructing partial dependence plots. R J., 9(1), 421-436.Available at: https://doi.org/10.32614/rj-2017-016.
Gunning, D. (2017). Explainable artificial intelligence (xai). Defense Advanced Research Projects Agency (DARPA), nd Web, 2(2), 11-17.
Gunning, D., & Aha, D. (2019). DARPA’s explainable artificial intelligence (XAI) program. AI Magazine, 40(2), 44-58.Available at: https://doi.org/10.1609/aimag.v40i2.2850.
Kwon, S.-H., & Ahn, B.-H. (2018). Development and validation of a simulation model for predicting the supply and demand of elementary school teachers. Learner-Centered Curriculum Education Research, 18(9), 23-44.Available at: https://doi.org/10.22251/jlcci.2018.18.9.23.
Lundberg, S. M., & Lee, S. I. (2017). Consistent feature attribution for tree ensembles. arXiv preprint arXiv:1706.06060.
OECD. (2021). Demography - fertility rates - OECD Data. Retrieved from: https://data.oecd.org/pop/fertility-rates.htm.
OECD. (2021). Teachers - students per teaching staff - OECD Data. Retrieved from: https://data.oecd.org/teachers/students-per-teaching-staff.htm.
Parsa, A. B., Movahedi, A., Taghipour, H., Derrible, S., & Mohammadian, A. K. (2020). Toward safer highways, application of XGBoost and SHAP for real-time accident detection and feature analysis. Accident Analysis & Prevention, 136, 1-17.Available at: https://doi.org/10.1016/j.aap.2019.105405.
Sejong, J., & Hyungjun, C. (2020). Seasonal time series prediction using machine learning. Journal of The Korean Data Analysis Society, 22, 1779-1791.
Young, L., Yookyung, H., & Leekyung, K. (2013). The direction of the teacher supply and demand policy based on the estimation of the number of future students and teachers in elementary and secondary school. Education and Finance Economy Research, 22(3), 59-79.
| Asian Online Journal Publishing Group is not responsible or answerable for any loss, damage or liability, etc. caused in relation to/arising out of the use of the content. Any queries should be directed to the corresponding author of the article. |