Students’ use of Cloud Storage in their Studies: A Case of a Private University in the Philippines
De La Salle University, Manila, Philippines.
Abstract
This paper seeks to determine factors affecting the students’ intention to use and actual use of the cloud storage systems such as Google Drive, iCloud and Microsoft One, etc. using the Unified Theory of Acceptance and Use of Technology. The respondents are students of leading private universities in the Philippines and the data were analyzed using Partial Lease Square – Structural Equation Model (PLS-SEM). PLS-SEM was conducted using SMART PLS software and the results showed that performance expectancy and social influence positively and significantly affects the intention to use cloud storage systems. Hence, the University should maintain its subscription of a cloud storage system and promote maximizing its use because large members of the academic community, the students, intend to use the cloud storage system as they perceive an increase in productivity of their schoolwork and due to increase by the community as well.
Keywords:System adoption, Cloud storage, E-learning, UTAUT, PLS-SEM, Cloud computing.
Contribution of this paper to the literature: This study contributes to the limited literature about cloud systems adoption. This study empirically proves the applicability or inapplicability of the constructs related to Unified Theory of Acceptance and Use of Technology to the specific group of people. The limitations presented in this paper provides another research opportunity for scholars who are interested in this field of study.
1. Background of the Study
Cloud Storage is a useful tool not only in businesses but also for a variety of use even for personal use. The advantages of using cloud storage as compared with the traditional offline storage are the back-ups are easily available with the provider, it can have larger storage capacity, and files can be mobile and accessible for use in different electronic devices and locations. These advantages are the top three purposes of using cloud storage in the USA (Statista, 2019a![]() ). The survey was created last October 2018 and had 603 respondents aged 18 and above who were using cloud services either for private or work purposes.
). The survey was created last October 2018 and had 603 respondents aged 18 and above who were using cloud services either for private or work purposes.
Students, in general, may benefit from these three advantages because schools give them a lot of assignments, sometimes to complete alone and sometimes with other members of the class who may be living further away. Thus, cloud storage enables them to do a lot of assignments even away from school and from each other. Also, part of the Statista survey, cloud storage provides the ability to share files (perfect for group schoolwork!) and can be used with other office applications. Hence, this study will seek to determine the factors influencing students’ acceptance and use of cloud storage using the Unified Theory of Acceptance and Use of Technology (UTAUT). Top cloud storage systems are Google Drive, iCloud, Dropbox, Microsoft OneDrive (Statista., 2019b![]() ). However, this study will not investigate the difference of perceptions for different types of cloud storage systems because clearly, this is another research opportunity. This study aims to know the determinants of students’ decisions to adopt or not adopt cloud-based storage using UTAUT.
). However, this study will not investigate the difference of perceptions for different types of cloud storage systems because clearly, this is another research opportunity. This study aims to know the determinants of students’ decisions to adopt or not adopt cloud-based storage using UTAUT.
2. Theoretical Framework
2.1. Unified Theory of Acceptance and Use of Technology (UTAUT)
UTAUT is a theory proposed by Venkatesh, Morris, Davis, and Davis (2003![]() ) MIS Quarterly. This theory served as an improved version of the Technology Acceptance Model (TAM). The framework and variables involved are shown in Figure 1.
) MIS Quarterly. This theory served as an improved version of the Technology Acceptance Model (TAM). The framework and variables involved are shown in Figure 1.
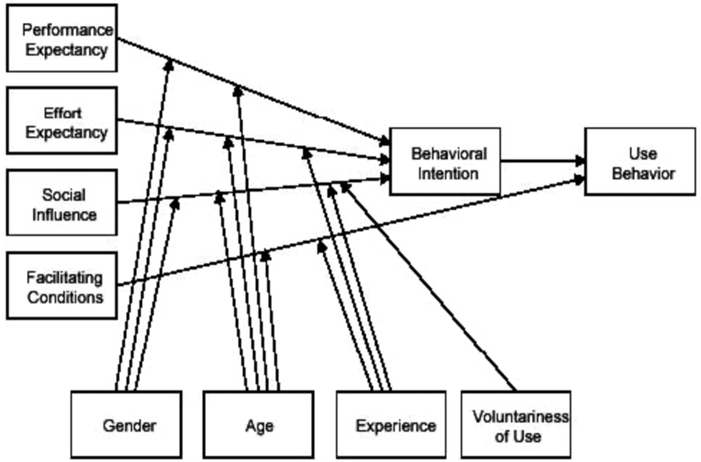
Figure-1. Unified theory of acceptance and use of technology framework.
Source: Venkatesh et al. (2003![]() ).
).
2.2. Performance Expectancy
This is the expectation of an individual that using a system will help him or her to improve job performance (Venkatesh et al., 2003![]() ). This variable was consistently found to be significantly affecting the behavioral intention of the individual (Taylor & Todd, 1995
). This variable was consistently found to be significantly affecting the behavioral intention of the individual (Taylor & Todd, 1995![]() ; Venkatesh & Davis, 2000
; Venkatesh & Davis, 2000![]() ; Venkatesh et al., 2003
; Venkatesh et al., 2003![]() ) . In the decision of adopting cloud storage, performance expectancy can be perceived as the expected benefit that each student would have when they use the cloud storage for their studies, notes, and various academic references.
) . In the decision of adopting cloud storage, performance expectancy can be perceived as the expected benefit that each student would have when they use the cloud storage for their studies, notes, and various academic references.
2.3. Effort Expectancy
This is the individual’s perception of the ease of use of the system (Venkatesh et al., 2003![]() ). For this study, effort expectancy is the students’ perception of the degree of use associated with the use of cloud storage for their studies, notes, and various academic references.
). For this study, effort expectancy is the students’ perception of the degree of use associated with the use of cloud storage for their studies, notes, and various academic references.
2.4. Social Influence
This is the person’s perception that important people around them expect that they will use the system (Venkatesh.... et al., 2003![]() ) and was found to have a direct impact on behavioral intention (Venkatesh & Davis, 2000
) and was found to have a direct impact on behavioral intention (Venkatesh & Davis, 2000![]() ; Venkatesh.... et al., 2003
; Venkatesh.... et al., 2003![]() ). However, in some studies, this was found not to be significantly affecting the behavior intention but affecting the actual use behavior instead in the context of the healthcare professional (Chau & Hu, 2001
). However, in some studies, this was found not to be significantly affecting the behavior intention but affecting the actual use behavior instead in the context of the healthcare professional (Chau & Hu, 2001![]() ; Chau & Hu, 2002
; Chau & Hu, 2002![]() ; Hu, Chau, Sheng, & Tam, 1999
; Hu, Chau, Sheng, & Tam, 1999![]() ) . Since the respondents for this study are different, we will retain the use of this construct and re-test its significance as in other studies (Taylor & Todd, 1995
) . Since the respondents for this study are different, we will retain the use of this construct and re-test its significance as in other studies (Taylor & Todd, 1995![]() ; Venkatesh, Morris, & Ackerman, 2000
; Venkatesh, Morris, & Ackerman, 2000![]() ). This paper viewed social influence as the student’s perception that they are expected to use cloud storage by some people or group of people like their classmates, for group activities; their professors, for homework collaboration; the university, for school engaged heavily in online courses; their family and other persons considered important to them for whatever use they may be.
). This paper viewed social influence as the student’s perception that they are expected to use cloud storage by some people or group of people like their classmates, for group activities; their professors, for homework collaboration; the university, for school engaged heavily in online courses; their family and other persons considered important to them for whatever use they may be.
2.5. Facilitating Conditions
This is the degree to which an individual believes that an organizational and technical infrastructure exists to support the use of the system (Venkatesh et al., 2003![]() ). The previous studies support the use of this construct in the UTAUT model (Igbaria, Zinatelli, Cragg, & Cavaye, 1997
). The previous studies support the use of this construct in the UTAUT model (Igbaria, Zinatelli, Cragg, & Cavaye, 1997![]() ; Venkatesh et al., 2003
; Venkatesh et al., 2003![]() ). This paper would consider facilitating conditions as the students’ perception of the University’s support of the use of the cloud storage exists like free use of computers, Wi-Fi connection, fast and reliable internet, etc.
). This paper would consider facilitating conditions as the students’ perception of the University’s support of the use of the cloud storage exists like free use of computers, Wi-Fi connection, fast and reliable internet, etc.
2.6. Behavioral Intention
This construct has been used widely not only in adoption theory but in any other theories which involved human intention and behavior like the Theory of Planned Behavior (Ajzen, 2011![]() ). However in UTAUT, this the intention to continue to use the system (Venkatesh & Goyal, 2010
). However in UTAUT, this the intention to continue to use the system (Venkatesh & Goyal, 2010![]() ; Venkatesh et al., 2003
; Venkatesh et al., 2003![]() ). This study viewed it as the students’ use-intention to continuously use the cloud storage for their studies.
). This study viewed it as the students’ use-intention to continuously use the cloud storage for their studies.
2.7. Use Behavior
The actual behavior can be viewed as a dichotomous variable with possible answers of adopted/used of not adopted/not used. However, Venkatesh et al. (2003![]() ) measured the duration of use of the system in UTAUT as the number of logs in the system. In this study, this will be measured in terms of the estimated number of hours of use per every instance of use.
) measured the duration of use of the system in UTAUT as the number of logs in the system. In this study, this will be measured in terms of the estimated number of hours of use per every instance of use.
2.8. Experience
This is the experience with the target system (usage right after training or after one month of use) or the experience using the system in months (Venkatesh, 2000![]() ; Venkatesh, Thong, & Xu, 2012
; Venkatesh, Thong, & Xu, 2012![]() ). This was found to influence effort expectancy, social influence, and facilitating conditions (Venkatesh et al., 2003
). This was found to influence effort expectancy, social influence, and facilitating conditions (Venkatesh et al., 2003![]() ). This study will measure this as the students’ length of use of cloud storage in months.
). This study will measure this as the students’ length of use of cloud storage in months.
2.9. Age and Gender
Just like how these were used in other studies, age and gender shall be measured as a normal demographic variable where the age is in years and the gender is male or female. Previous studies found that men strongly predicts performance expectancy while effort expectancy and social influence are predicted by women (Venkatesh et al., 2003![]() ). Besides, this also moderates all of the four main constructs: performance expectancy, effort expectancy, social influence, and facilitating conditions (Venkatesh et al., 2003
). Besides, this also moderates all of the four main constructs: performance expectancy, effort expectancy, social influence, and facilitating conditions (Venkatesh et al., 2003![]() ). For this study, age was not used as a moderating variable because, in University, the differences of ages are too little because there were about four to five years to complete a degree.
). For this study, age was not used as a moderating variable because, in University, the differences of ages are too little because there were about four to five years to complete a degree.
2.10. Voluntariness
This refers to whether the system is required or completely voluntary and not mandatory. This was proved to influence only social influence (Venkatesh et al., 2003![]() ). However, this study did not consider this construct because the University does not have mandatory use of any cloud storage for the moment.
). However, this study did not consider this construct because the University does not have mandatory use of any cloud storage for the moment.
In reference to the above theoretical framework, this paper would test using the conceptual framework in Figure 2. As shown in Figure 2, the moderating variables age and voluntariness of use were removed. As discussed above, the ages of the students were not expected to materially differ from each other because there is an average of four to five years only to complete a college degree. Also, the use of cloud storage is not compulsory for use at the University.
3. Review of Related Literature
3.1. Cloud Storage
Cloud Storage is a part of the greater term =cloud computing. This is a widely used term in the field of Engineering and Innovation and was defined by the United States (US) National Institute of Standards and Technology (NIST) as “a model for enabling convenient, on-demand network access to a shared pool of configurable computing resources that can be rapidly provisioned and released with minimal management effort or service provider interaction” (Mell & Grance, 2011![]() ).
).
There are three main layers of this cloud computing: Software as a Service (SaaS), Platform as a Service (PaaS) and Infrastructure as a Service (IaaS) (Goscinski & Brock, 2010![]() ; Lian, 2015
; Lian, 2015![]() ; Low, Chen, & Wu, 2011
; Low, Chen, & Wu, 2011![]() ) . Different layers serve a different purpose: SaaS serves the end-users by providing an application on demand; PaaS, serves the developers by providing access to computers and database on virtual basis; and lastly, the IaaS serves the network architect by providing storage, servers, hardware and other network components (Goscinski & Brock, 2010
) . Different layers serve a different purpose: SaaS serves the end-users by providing an application on demand; PaaS, serves the developers by providing access to computers and database on virtual basis; and lastly, the IaaS serves the network architect by providing storage, servers, hardware and other network components (Goscinski & Brock, 2010![]() ; Low et al., 2011
; Low et al., 2011![]() ). Cloud storage cannot be identified as part of any one of the layers but is present in all of the layers.
). Cloud storage cannot be identified as part of any one of the layers but is present in all of the layers.
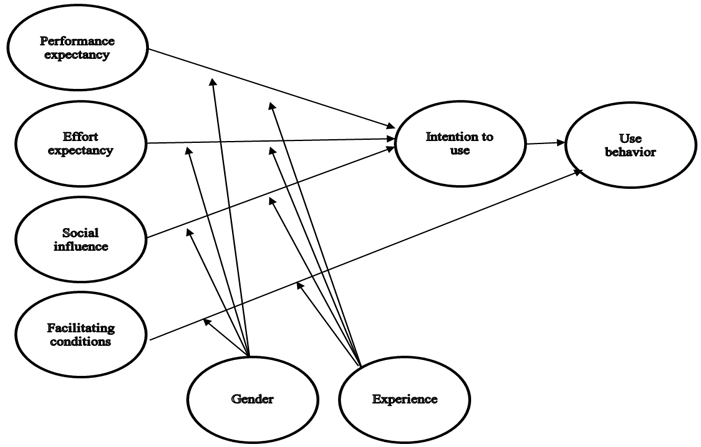
Figure-2. Conceptual Framework for this study.
3.2. System Adoption Literatures
Technology adoption has been studied from different perspectives by different scholars using different theories and models. For instance, a study of the adoption of cloud-based e-learning used Technology Acceptance Model (TAM) as a framework. Their results showed that the perceived usefulness, perceived ease of use, age, gender, subjective norm and trust, computer anxiety, computer self-efficacy, and internet self-efficacy affect the adoption of cloud-based e-learning (Arpaci, 2016![]() ; Ashtari & Eydgahi, 2015
; Ashtari & Eydgahi, 2015![]() ; Burda & Teuteberg, 2014
; Burda & Teuteberg, 2014![]() ; Tarhini, Hone, & Liu, 2014
; Tarhini, Hone, & Liu, 2014![]() ; Tarhini, Hone, & Liu, 2015
; Tarhini, Hone, & Liu, 2015![]() ) . An extended TAM was used to conduct an empirical study which resulted in knowing that user’s intentions and behavior were influenced in large part by the functions available in cloud services such as availability, accessibility, security, and reliability (Shin., 2013
) . An extended TAM was used to conduct an empirical study which resulted in knowing that user’s intentions and behavior were influenced in large part by the functions available in cloud services such as availability, accessibility, security, and reliability (Shin., 2013![]() ). These functions were known as the antecedents of perceived usefulness and perceived ease of use.
). These functions were known as the antecedents of perceived usefulness and perceived ease of use.
Al-Gahtani (2016![]() ) made an adoption study of cloud-based e-learning using both TAM and marketing theory, Theory of Planned Behavior (TPB). Both theories were used by Al-Gahtani (2016
) made an adoption study of cloud-based e-learning using both TAM and marketing theory, Theory of Planned Behavior (TPB). Both theories were used by Al-Gahtani (2016![]() ) because both explain the common endpoint which is the actual behavior of the user. The results revealed that perceived usefulness and ease of use affect the intention to use (Al-Gahtani, 2016
) because both explain the common endpoint which is the actual behavior of the user. The results revealed that perceived usefulness and ease of use affect the intention to use (Al-Gahtani, 2016![]() ). Other scholars used other theories to explain the phenomenon of technology adoption like the Innovation Diffusion Theory (IDT) and Technology-Organization-Environment (TOE) model. The IDT was used by Sun (2012
). Other scholars used other theories to explain the phenomenon of technology adoption like the Innovation Diffusion Theory (IDT) and Technology-Organization-Environment (TOE) model. The IDT was used by Sun (2012![]() ) to establish a theoretical model that explores different factors the might affect the user’s adoption intention of cloud computing.
) to establish a theoretical model that explores different factors the might affect the user’s adoption intention of cloud computing.
Ding and Wu (2012![]() ) used the TOE model from Tomatzky and Fleischer (1990
) used the TOE model from Tomatzky and Fleischer (1990![]() ) to study the cloud services adoption of the Chinese government. Their results found that it could be investigated from environmental factors, organizational factors and cloud computing technical characteristics. The first factor covers the support from the government and public, and successful case; the second factor consists of top management attitude, organizational financial sensitivity, organizational IT maturity and organizational tolerant of IT innovation; and the last consists of security level, the degree of matching with the strategy of organization and legacy systems’ compatibility.
) to study the cloud services adoption of the Chinese government. Their results found that it could be investigated from environmental factors, organizational factors and cloud computing technical characteristics. The first factor covers the support from the government and public, and successful case; the second factor consists of top management attitude, organizational financial sensitivity, organizational IT maturity and organizational tolerant of IT innovation; and the last consists of security level, the degree of matching with the strategy of organization and legacy systems’ compatibility.
A more advanced model of adoption theory that stemmed from and as an extension of TAM is the Unified Theory of Acceptance and Use of Technology (UTAUT). Scholars re-examined the adoption papers using UTAUT instead of TAM and found that performance expectancy, effort expectancy, social influence, facilitating conditions, perceived risks, perceived cost, personal innovativeness are the factors that affect the adoption of cloud technology (Bellaaj, Zekri, & Albugami, 2015![]() ; Cao, Bi, & Wang, 2013
; Cao, Bi, & Wang, 2013![]() ; Nguyen, Nguyen, Pham, & Misra, 2014
; Nguyen, Nguyen, Pham, & Misra, 2014![]() ; Nguyen, Nguyen, & Cao, 2014
; Nguyen, Nguyen, & Cao, 2014![]() ) .
) .
Other studies who used models and frameworks that are quite not directly or indirectly related with common adoption theories have noted that adoption behavior of the users of cloud computing is top management support, relative advantage, firm size, pressures from trading partners and competitors (Low et al., 2011![]() ); the uncertainty of task, environment, and inter-organization (Cegielski, Jones-Farmer, Wu, & Hazen, 2012
); the uncertainty of task, environment, and inter-organization (Cegielski, Jones-Farmer, Wu, & Hazen, 2012![]() ); and from the point of view of IT professionals, the compatibility of the cloud computing with the company’s policy, information system environment, business needs and advantage (Lin & Chen, 2012
); and from the point of view of IT professionals, the compatibility of the cloud computing with the company’s policy, information system environment, business needs and advantage (Lin & Chen, 2012![]() ).
).
Given different theoretical bases, TAM and UTAUT were tested if they will yield the same results. Ratten (2015![]() ) concluded that it has a similar effect after deploying the instruments in the USA and Turkey. However, Venkatesh et al. (2003
) concluded that it has a similar effect after deploying the instruments in the USA and Turkey. However, Venkatesh et al. (2003![]() ) have comprehensively discussed why UTAUT is a superior adoption theory than TAM. The Unified Theory of Acceptance and User of Technology (UTAUT) has integrated eight (8) theories including Theory of Reasoned Action (TRA), Innovation Diffusion Theory (IDT), Social Cognitive Theory (SCT) and so on (Venkatesh et al., 2003
) have comprehensively discussed why UTAUT is a superior adoption theory than TAM. The Unified Theory of Acceptance and User of Technology (UTAUT) has integrated eight (8) theories including Theory of Reasoned Action (TRA), Innovation Diffusion Theory (IDT), Social Cognitive Theory (SCT) and so on (Venkatesh et al., 2003![]() ). There were six (6) core variables in UTAUT named: Performance expectancy, effort expectancy, social influence, facilitating conditions, behavioral intention, and use-behavior. Moderating variables such as gender, age, experience, and voluntariness were also included in the model (cite UTAUT authors).
). There were six (6) core variables in UTAUT named: Performance expectancy, effort expectancy, social influence, facilitating conditions, behavioral intention, and use-behavior. Moderating variables such as gender, age, experience, and voluntariness were also included in the model (cite UTAUT authors).
UTAUT was widely used in different fields of information systems, emerging information technologies, user adoption, e-commerce, mobile commerce, web services, etc. (Chong, 2013![]() ; Hung, Chang, & Yu, 2006
; Hung, Chang, & Yu, 2006![]() ; Im, Kim, & Han, 2008
; Im, Kim, & Han, 2008![]() ; Min, Ji, & Qu, 2008
; Min, Ji, & Qu, 2008![]() ; San Martín & Herrero, 2012
; San Martín & Herrero, 2012![]() ; Shin, 2009
; Shin, 2009![]() ) . Thus, it can be best used in testing the user adoption of cloud storage service adoption (Cao et al., 2013
) . Thus, it can be best used in testing the user adoption of cloud storage service adoption (Cao et al., 2013![]() ).
).
Given all this information on user adoption for cloud storage, a question arises: “Will these results hold in the Philippines?” We know that it is not part of the first world where the majority, if not all, of the technological developments, were born. Are users here ready? If not, what will make them adopt? Which particular user group? A group that relies largely on bulk documentation for their work: students? Thus, to the researcher wanted to answer the problem: What influences students’ decision to adopt cloud storage for documenting their works?
3.3. Hypotheses
Direct effects
H1 – Performance expectancy has no significant effect on the intention to use cloud storage.
H2 – Effort expectancy has no significant effect on the intention to use cloud storage.
H3 – Social influence has no significant effect on the intention to use cloud storage.
H4 – Facilitating condition has no significant effect on the actual behavior to use cloud storage.
H5 – Intention to use has no significant effect on the actual use behavior of cloud storage.
3.4. Mediating Effects
H6 – Intention to use does not mediate the effect of performance expectancy on actual use behavior of cloud storage.
H7 – Intention to use does not mediate the effect of effort expectancy on actual use behavior of cloud storage.
H8 – Intention to use does not mediate the effect of social influence on actual use behavior of cloud storage.
3.5. Moderating Effects of Gender
H9 – Gender does not moderate the effect of performance expectancy on the intention to use cloud storage.
H10 – Gender does not moderate the effect of effort expectancy on the intention to use cloud storage.
H11 – Gender does not moderate the effect of social influence on the intention to use cloud storage.
H12 – Gender does not moderate the effect of facilitating conditions on actual use behavior of cloud storage.
3.6. Moderating Effects of Experience
H13 – Experience does not moderate the effect of performance expectancy on the intention to use cloud storage.
H14 – Experience does not moderate the effect of effort expectancy on the intention to use cloud storage.
H15 – Experience does not moderate the effect of social influence on the intention to use cloud storage.
H16 – Experience does not moderate the effect of facilitating conditions on actual use behavior of cloud storage.
4. Method(s) of Data Collection and Analysis
4.1. Research Design, Population, and Sampling
The paper used a quantitative research design to test the causality of the variables involved and the population consists of University students. The most recent student count in the University website as of this writing showed that there are 11,527 students, with 6,123 male and 5404 female students. Using slovin’s formula, a total of 327 students were sampled. The data was gathered between March 15 to April 15, 2020, using an online survey because this occurred during the enhanced community quarantine in the Philippines due to the threat of COVID-19.
4.2. Research Instrument & Statistical Analysis
The questionnaires used in the study are existing scales from the seminal study, used in research after the seminal works and word-adjusted to fit in the context of this study. All the questions have used a 7-point Likert-scale. Table 1 summarizes the questions in each respective scale. The scales were tested for Cronbach’s alpha for reliability and internal consistency (Cronbach, 1951![]() ) except for constructs with one question originally and those that were reduced to one question due to high multi-collinearity (variance inflation factor) among the questions (indicators) in the assessment of measurement model. This study used the Partial Least Square – Structural Equation Model (PLS-SEM) to test the effect seamlessly by running the model altogether.
) except for constructs with one question originally and those that were reduced to one question due to high multi-collinearity (variance inflation factor) among the questions (indicators) in the assessment of measurement model. This study used the Partial Least Square – Structural Equation Model (PLS-SEM) to test the effect seamlessly by running the model altogether.
5. Results and Discussions
The first step in analyzing using PLS-SEM is to assess the measurement model using indicator reliability, convergent reliability, internal consistency, and discriminant validity. These were determined using the Consistent PLS Algorithm instead of PLS Algorithm because the constructs used were reflective scales for having a mutually interchangeable composite reliability (Ketchen, 2013![]() ).
).
Indicator reliability is a good indicator reliability measure using indicator loadings and Cronbach’s alpha. Indicator loadings must have a value greater than 0.50 (Hair et al., 1987 & 2009, as cited in Kock (2015![]() ) and this serves as validation parameters of confirmatory factor analysis (Kock, 2015
) and this serves as validation parameters of confirmatory factor analysis (Kock, 2015![]() ) while Cronbach’s alpha must be at least 0.70 (Ketchen, 2013
) while Cronbach’s alpha must be at least 0.70 (Ketchen, 2013![]() ; Peterson, 1994
; Peterson, 1994![]() ) or at least 0.60 (Robinson, Shaver, & Wrightsman, 1991
) or at least 0.60 (Robinson, Shaver, & Wrightsman, 1991![]() ) for social psychology research, to conclude that they are reliable.
) for social psychology research, to conclude that they are reliable.
Convergent reliability is assessed using Average Variance Extracted (AVE) and this value is ranging from 0 to 1 where the value at least 0.5 is considered a good indicator (Kock, 2015![]() ) which means that 50% of the variance of its indicators on average was explained by the construct (Fornell & Larcker, 1981
) which means that 50% of the variance of its indicators on average was explained by the construct (Fornell & Larcker, 1981![]() ).
).
Table-1. Research instruments.
| Variables | Questions | References |
| Performance expectancy |
|
Venkatesh et al. (2003 |
| Effort expectancy |
|
Brown, Dennis, and Venkatesh (2010 |
| Social influence |
|
Venkatesh et al. (2003 |
| Facilitating condition |
|
Venkatesh et al. (2003 |
| Behavioral intention |
|
Davis, Bagozzi, and Warshaw (1989 |
| Use behavior |
|
Venkatesh et al. (2003 |
| Experience |
|
Venkatesh et al. (2012 |
Internal consistency is assessed using Composite Reliability (CR) (Jöreskog, 1971![]() ) which is considered acceptable if the value is at least 0.60 to 0.70 for exploratory research or 0.70 to 0.90 generally considered satisfactory to good. If CR is at least 0.95 and higher, that indicates redundancy among the indicators which reduces its reliability (Diamantopoulos, Sarstedt, Fuchs, Wilczynski, & Kaiser, 2012
) which is considered acceptable if the value is at least 0.60 to 0.70 for exploratory research or 0.70 to 0.90 generally considered satisfactory to good. If CR is at least 0.95 and higher, that indicates redundancy among the indicators which reduces its reliability (Diamantopoulos, Sarstedt, Fuchs, Wilczynski, & Kaiser, 2012![]() ; Drolet & Morrison, 2001
; Drolet & Morrison, 2001![]() ). In our results below, there are CR values of 1.000 but not considered problematic because the was one indicator left after treating reliability problems. All these measures collectively are called construct reliability and validity in SMART-PLS software and they all met the required threshold as shown in Table 2.
). In our results below, there are CR values of 1.000 but not considered problematic because the was one indicator left after treating reliability problems. All these measures collectively are called construct reliability and validity in SMART-PLS software and they all met the required threshold as shown in Table 2.
Table-2. Measurement model assessment – Construct Reliability and Validity
| Constructs | Items |
Loadings (original) |
Loadings (removed) |
AVE |
CR |
Cronbach’s Alpha |
| Performance expectancy | PE1 |
0.858 |
0.858 |
0.617 |
0.866 |
0.865 |
PE2 |
0.722 |
0.722 |
||||
PE3 |
0.762 |
0.762 |
||||
PE4 |
0.770 |
0.770 |
||||
| Effort expectancy | EE1 |
0.870 |
0.870 |
0.712 |
0.908 |
0.908 |
EE2 |
0.840 |
0.840 |
||||
EE3 |
0.886 |
0.886 |
||||
EE4 |
0.778 |
0.778 |
||||
| Social Influence | SI1 |
0.729 |
0.729 |
|||
SI2 |
0.678 |
0.678 |
||||
SI3 |
0.967 |
0.967 |
||||
SI4 |
0.884 |
0.884 |
||||
| Facilitating Condition | FC1 |
-0.018 |
- |
1.000 |
1.000 |
1.000 |
FC2 |
0.117 |
- |
||||
FC3 |
-0.275 |
- |
||||
FC4 |
0.253 |
1.000 |
||||
| Intention to Use | BI1 |
0.957 |
1.000 |
1.000 |
1.000 |
1.000 |
BI2 |
1.0101 |
- |
||||
BI3 |
0.931 |
- |
||||
| Use Behavior | UB1 |
1.000 |
1.000 |
Note: PE – Performance expectancy, EE – Effort expectancy, SI – Social Influence, FC – Facilitating Condition, BI – Behavioral Intention, UB – Use Behavior and numbers represents the questions in the scale.
Discriminant validity or vertical collinearity is the subjective independence of every indicator on its latent variable. This can be measured by the Fornell-Larcker criterion, cross-loading criterion, and alternatively by heterotrait-monotrait (HTMT) ratio of correlations. The first one helps reduce the presence of multicollinearity among the latent variables and is measured by ensuring that the square root of AVE of the latent variable is higher than correlation coefficients of that latent variable with other latent variables as shown in Table 3 (Fornell & Larcker, 1981![]() ).
).
Cross loading is the same concept as Fornell-Larcker except that the values are tagged on per indicator level rather than per latent variable or construct (see Table 4). Finally, HTMT is the mean value of the item correlations across constructs relative to the mean of the average correlations for the items measuring the same construct. Generally, HTMT values should not be equal to or greater than 1 but (Henseler, Ringle, & Sarstedt, 2015![]() ) suggest that a proposed threshold value of 0.90 for structural models with constructs that are very similar (see Table 5). Each respective table showed that the values have passed the criteria for discriminant validity.
) suggest that a proposed threshold value of 0.90 for structural models with constructs that are very similar (see Table 5). Each respective table showed that the values have passed the criteria for discriminant validity.
Table-3. Measurement model assessment – discriminant validity: Fornell-Larcker.
| Latent Variables | Performance Expectancy |
Effort Expectancy |
Social Influence |
Facilitating Condition |
Intention to Use |
Use Behavior |
| Performance Expectancy | 0.786 |
|||||
| Effort Expectancy | 0.704 |
0.844 |
||||
| Social Influence | 0.627 |
0.449 |
0.823 |
|||
| Facilitating Condition | 0.028 |
0.122 |
0.188 |
1.000 |
||
| Intention to Use | 0.788 |
0.673 |
0.638 |
0.027 |
1.000 |
|
| Use Behavior | 0.309 |
0.159 |
0.383 |
0.180 |
0.181 |
1.000 |
Note: The bold figures are the square root of AVE while others are the correlation coefficients.
Table-4. Measurement model assessment – discriminant validity: cross loadings.
| Indicators | Performance Expectancy |
Effort Expectancy |
Social Influence |
Facilitating Condition |
Intention to Use |
Use Behavior |
| PE1 | 0.767 |
0.631 |
0.516 |
-0.040 |
0.604 |
0.264 |
| PE2 | 0.749 |
0.530 |
0.538 |
-0.059 |
0.590 |
0.322 |
| PE3 | 0.812 |
0.515 |
0.470 |
0.095 |
0.640 |
0.225 |
| PE4 | 0.812 |
0.540 |
0.452 |
0.081 |
0.640 |
0.169 |
| EE1 | 0.654 |
0.886 |
0.445 |
0.112 |
0.596 |
0.163 |
| EE2 | 0.564 |
0.836 |
0.448 |
0.137 |
0.563 |
0.185 |
| EE3 | 0.621 |
0.883 |
0.314 |
0.064 |
0.594 |
0.062 |
| EE4 | 0.531 |
0.767 |
0.304 |
0.102 |
0.516 |
0.130 |
| SI1 | 0.447 |
0.257 |
0.713 |
0.234 |
0.455 |
0.340 |
| SI2 | 0.428 |
0.266 |
0.679 |
0.138 |
0.434 |
0.380 |
| SI3 | 0.563 |
0.456 |
0.964 |
0.171 |
0.615 |
0.323 |
| SI4 | 0.605 |
0.458 |
0.898 |
0.092 |
0.573 |
0.249 |
| FC4 | 0.028 |
0.122 |
0.188 |
1.000 |
0.027 |
0.180 |
| BI1 | 0.788 |
0.673 |
0.638 |
0.027 |
1.000 |
0.181 |
| UB1 | 0.309 |
0.159 |
0.383 |
0.180 |
0.181 |
1.000 |
Table-5. Measurement model assessment – Discriminant Validity: HTMT.
| Latent Variables | Performance Expectancy |
Effort Expectancy |
Social Influence |
Facilitating Condition |
Intention to Use |
Use Behavior |
| Performance Expectancy | ||||||
| Effort Expectancy | 0.704 |
|||||
| Social Influence | 0.624 |
0.435 |
||||
| Facilitating Condition | 0.088 |
0.123 |
0.193 |
|||
| Intention to Use | 0.788 |
0.672 |
0.631 |
0.027 |
||
| Use Behavior | 0.312 |
0.160 |
0.392 |
0.180 |
0.181 |
The result of the measurement model assessment is satisfactory which permits us to continue with the structural model assessment. Using SMART-PLS, this was tested using bootstrapping the results of which are presented in Table 6. As shown, performance expectancy and social influence are significantly and positively associated with the intention to use. This was supported by a high r-squared of 68% (Chin, 1998![]() ) which denotes that 68% variance in intention to use was determined by performance expectancy, effort expectancy, and social influence. This was corroborated by considerably large predictive relevance (q2) of 0.578 (Fornell & Cha, 1994
) which denotes that 68% variance in intention to use was determined by performance expectancy, effort expectancy, and social influence. This was corroborated by considerably large predictive relevance (q2) of 0.578 (Fornell & Cha, 1994![]() ).
).
Table-6. Structural model assessment – bootstrapping: path coefficients of direct and mediation.
| Hypothesis | Path relationship | Beta |
Std. Dev. |
t-value |
Decision |
f2 |
q2 |
R2 |
| H1 | PE->BI | 0.477 |
0.180 |
2.643** |
Reject |
0.274 |
0.578 |
0.682 |
| H2 | EE->BI | 0.232 |
0.147 |
1.582 |
Do not reject |
0.086 |
||
| H3 | SI->BI | 0.235 |
0.105 |
2.234** |
Reject |
0.106 |
||
| H4 | FC->UB | 0.175 |
0.103 |
1.695* |
Do not reject |
0.033 |
0.029 |
0.063 |
| H5 | BI->UB | 0.176 |
0.103 |
1.706* |
Do not reject |
0.033 |
||
| H6 | PE->UB | 0.084 |
0.062 |
1.350 |
Do not reject |
|||
| H7 | EE->UB | 0.041 |
0.039 |
1.038 |
Do not reject |
|||
| H8 | SI->UB | 0.042 |
0.034 |
1.217 |
Do not reject |
Note: *p-value < .1, **p-value < .05
The predictive relevance of exogenous constructs was conducted using a blindfolding technique where every nth data point in endogenous constructs (predictors) is omitted and estimate the parameters using the remaining data points (Chin, 1998![]() ). Thus, this is like the opposite of the bootstrapping technique where parameters are estimated using sample size way larger than the original sample size (Chin, 1998
). Thus, this is like the opposite of the bootstrapping technique where parameters are estimated using sample size way larger than the original sample size (Chin, 1998![]() ). Lastly, of all predictors, only performance expectancy has a medium effect size (f2) of 0.274 and the rest has a small effect size. This means that if such a construct was omitted, it will have a significant impact on the exogenous variable (outcome). This also could be the reason why performance expectancy showed significant p-value. Despite social influence showing significant p-value, it does not have the medium effect size for having 0.106 because medium is at least 0.15 (Cohen, 1988
). Lastly, of all predictors, only performance expectancy has a medium effect size (f2) of 0.274 and the rest has a small effect size. This means that if such a construct was omitted, it will have a significant impact on the exogenous variable (outcome). This also could be the reason why performance expectancy showed significant p-value. Despite social influence showing significant p-value, it does not have the medium effect size for having 0.106 because medium is at least 0.15 (Cohen, 1988![]() ). The test for moderation is shown in Table 7. As presented, none of the moderating variables were considered significant.
). The test for moderation is shown in Table 7. As presented, none of the moderating variables were considered significant.
Table-7. Structural model assessment – Bootstrapping: Path coefficients for Moderating effects
| Hypothesis | Path relationship | Beta |
Std. Dev. |
t-value |
Decision | f2 |
q2 |
R2 |
| H9 | PE*G->BI | 0.110 |
1.468 |
0.075 |
Do not reject | 0.027 |
0.528 |
0.698 |
| H10 | EE*G->BI | -0.168 |
0.982 |
0.171 |
Do not reject | 0.046 |
||
| H11 | SI*G->BI | 0.058 |
0.226 |
0.256 |
Do not reject | 0.006 |
||
| H12 | FC*G->UB | 0.102 |
0.98 |
1.040 |
Do not reject | 0.011 |
0.029 |
0.074 |
| H13 | PE*E->BI | -0.098 |
13.785 |
0.007 |
Do not reject | 0.015 |
0.567 |
0.704 |
| H14 | EE*E->BI | 0.036 |
11.168 |
0.003 |
Do not reject | 0.002 |
||
| H15 | SI*E->BI | -0.106 |
0.973 |
0.109 |
Do not reject | 0.016 |
||
| H16 | FC*E->UB | 0.024 |
0.091 |
0.263 |
Do not reject | 0.001 |
-0.003 |
0.089 |
Note: *p-value < .1, **p-value < .05.
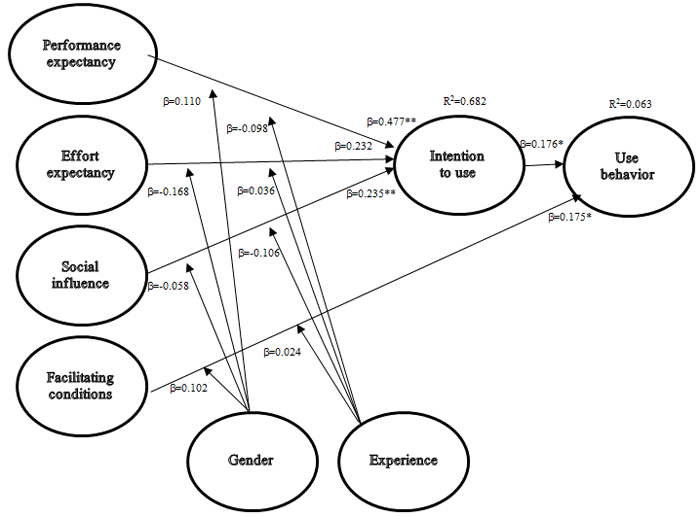
Figure-3. Path diagram and PLS estimations.
Based on the results of the testing above, the conceptual framework for this study was presented in Figure 3 showing the respective path coefficients and various PLS estimations.
6. Conclusion and Recommendations
This paper has investigated the factors affecting the intention to use and subsequent actual use of cloud storage by the students for their studies. This was anchored from the Unified Theory of Acceptance and Use of Technology (UTAUT). The results showed that out of four independent constructs, only performance expectancy and social influence have a significant positive effect on the intention to use. This result is consistent with the findings of previous researches that used UTAUT and TAM (Arpaci, 2016![]() ; Ashtari & Eydgahi, 2015
; Ashtari & Eydgahi, 2015![]() ; Burda & Teuteberg, 2014
; Burda & Teuteberg, 2014![]() ; Tarhini et al., 2014
; Tarhini et al., 2014![]() ; Tarhini. et al., 2015
; Tarhini. et al., 2015![]() ) . Though effort expectancy and facilitating conditions were found to be significant in previous researches (Bellaaj et al., 2015
) . Though effort expectancy and facilitating conditions were found to be significant in previous researches (Bellaaj et al., 2015![]() ; Cao et al., 2013
; Cao et al., 2013![]() ; Nguyen et al., 2014
; Nguyen et al., 2014![]() ; Nguyen. et al., 2014
; Nguyen. et al., 2014![]() ) , our study showed a surprisingly different result.
) , our study showed a surprisingly different result.
This is primarily due to the nature of the respondents. Some of the previous research was made in the workplace where employees are likely to use a system for being easy to use it so that they can maximize their time savings from ease of use of the system to a more valuable portion of their work (effort expectancy) and where the company that they work with may have strong support and inclination to use the system (facilitating condition). These events did not exist in school settings because given that use of cloud storage is not mandatory in the University, the students were not inclined to use the cloud storage despite the ease of its use (effort expectancy) and the University does not need to secure support in terms of hardware or software to students (facilitating conditions).
Significant and positive performance expectancy means that as students see their schoolwork, be it individual or grouped, can be managed and completed effectively and efficiently with the use of cloud storage, they are likely to use a cloud storage system. Also, a significant and positive social influence suggests that as students’ peers and teachers use cloud storage and expect them to use it as well, they are likely to use such a cloud storage system. The use of the system enables them to easily store, access, retrieve, and share the documents online and enable them to have seamless working routines and relationships.
Thus, it is recommended to the University that they must maintain its current subscription with one of the cloud storage systems. This enables the community to increase its productivity through an efficient and effective way of delivering lectures, sharing academic papers, and working with groups anytime, anywhere. In addition, active training to all members of the community should be rolled-out so that majority of the members will appreciate the use and they may become a brand ambassador that will persuade others who are not inclined yet to use. This way, they can encourage everyone to use the system thereby increasing productivity and at the same time maximize the fixed cost of subscribing to such a cloud storage system.
For future researchers, this could be explored more to different sets of respondents with a combination of longitudinal data because the constructs of UTAUT are latent which means they can change from one point in time to another. Secondly, a cross-category study may be performed comparing the results for each type of cloud storage system, employees vs. students, and even cross generations. This can be done through moderation, controlling the data, or the use of multi-group analysis function of PLS-SEM.
Citation| Jerwin Baquir Tubay (2021). Students’ use of Cloud Storage in their Studies: A Case of a Private University in the Philippines. Journal of Education and e-Learning Research, 8(1): 16-25. |
References
Ajzen, I. (2011). The theory of planned behavior. Organizational Behavior and Human Decision Processes, 50(2), 179-211.
Al-Gahtani, S. S. (2016). Empirical investigation of e-learning acceptance and assimilation: A structural equation model. Applied Computing and Informatics, 12(1), 27-50.
Arpaci, I. (2016). Understanding and predicting students' intention to use mobile cloud storage services. Computers in Human Behavior, 58, 150-157. Available at: https://doi.org/10.1016/j.chb.2015.12.067.
Ashtari, S., & Eydgahi, A. (2015). Student perceptions of cloud computing effectiveness in higher education. Paper presented at the In 2015 IEEE 18th International Conference on Computational Science and Engineering. IEEE.
Bellaaj, M., Zekri, I., & Albugami, M. (2015). The continued use of e-learning system: An empirical investigation using UTAUT model at the University of Tabuk. Journal of Theoretical & Applied Information Technology, 72(3), 464-474.
Brown, S. A., Dennis, A. R., & Venkatesh, V. (2010). Predicting collaboration technology use: Integrating technology adoption and collaboration research. Journal of Management Information Systems, 27(2), 9-54. Available at: https://doi.org/10.2753/mis0742-1222270201.
Burda, D., & Teuteberg, F. (2014). The role of trust and risk perceptions in cloud archiving—Results from an empirical study. The Journal of High Technology Management Research, 25(2), 172-187. Available at: https://doi.org/10.1016/j.hitech.2014.07.008.
Cao, Y., Bi, X., & Wang, L. (2013). A study on user adoption of cloud storage service in China: A revised unified theory of acceptance and use of technology model. Paper presented at the In 2013 International Conference on Information Science and Cloud Computing Companion. IEEE.
Cegielski, C. G., Jones-Farmer, L. A., Wu, Y., & Hazen, B. T. (2012). Adoption of cloud computing technologies in supply chains: An organizational information processing theory approach. The International Journal of Logistics Management, 23(2), 184-211. Available at: https://doi.org/10.1108/09574091211265350.
Chau, P. Y., & Hu, P. J. H. (2001). Information technology acceptance by individual professionals: A model comparison approach. Decision Sciences, 32(4), 699-719. Available at: https://doi.org/10.1111/j.1540-5915.2001.tb00978.x.
Chau, P. Y., & Hu, P. J.-H. (2002). Investigating healthcare professionals’ decisions to accept telemedicine technology: An empirical test of competing theories. Information & Management, 39(4), 297-311. Available at: https://doi.org/10.1016/s0378-7206(01)00098-2.
Chin, W. W. (1998). The partial least squares approach to structural equation modeling. In G. Marcoulides (Ed.), Modern methods for business research (pp. 295–358). Mahwah, NJ: Lawrence Erlbaum Associates.
Chong, A. Y.-L. (2013). Predicting m-commerce adoption determinants: A neural network approach. Expert Systems with Applications, 40(2), 523-530. Available at: https://doi.org/10.1016/j.eswa.2012.07.068.
Cohen, J. (1988). Statistical power analysis for the behavioral sciences (2nd ed.). Hillsdale, N.J: Lawrence Erlbaum Associates.
Cronbach, L. J. (1951). Coefficient alpha and the internal structure of tests. Psychometrika, 16(3), 297–335.
Davis, F. D., Bagozzi, R. P., & Warshaw, P. R. (1989). User acceptance of computer technology: A comparison of two theoretical models. Management Science, 35(8), 982-1003. Available at: https://doi.org/10.1287/mnsc.35.8.982.
Diamantopoulos, A., Sarstedt, M., Fuchs, C., Wilczynski, P., & Kaiser, S. (2012). Guidelines for choosing between multi-item and single-item scales for construct measurement: A predictive validity perspective. Journal of the Academy of Marketing Science, 40(3), 434-449. Available at: https://doi.org/10.1007/s11747-011-0300-3.
Ding, F., & Wu, J. (2012). The cause of government organizations adopt cloud computing analysis. China Economic & Trade Herald, 2012(31), 75-77.
Drolet, A. L., & Morrison, D. G. (2001). Do we really need multiple-item measures in service research? Journal of Service Research, 3(3), 196-204. Available at: https://doi.org/10.1177/109467050133001.
Fornell, C., & Larcker, D. F. (1981). Structural equation models with unobservable variables and measurement error: Algebra and statistics. Journal of Marketing Research, 18(3), 382–388.
Fornell, C., & Cha, J. (1994). Partial least squares. In R. P. Bagozzi (Ed.), Advanced methods of marketing research (pp. 52–78). Cambridge, England: Blackwell.
Goscinski, A., & Brock, M. (2010). Toward dynamic and attribute based publication, discovery and selection for cloud computing. Future Generation Computer Systems, 26(7), 947-970. Available at: https://doi.org/10.1016/j.future.2010.03.009.
Henseler, J., Ringle, C. M., & Sarstedt, M. (2015). A new criterion for assessing discriminant validity in variance-based structural equation modeling. Journal of the Academy of Marketing Science, 43(1), 115-135. Available at: https://doi.org/10.1007/s11747-014-0403-8.
Hu, P. J., Chau, P. Y., Sheng, O. R. L., & Tam, K. Y. (1999). Examining the technology acceptance model using physician acceptance of telemedicine technology. Journal of Management Information Systems, 16(2), 91-112. Available at: https://doi.org/10.1080/07421222.1999.11518247.
Hung, S. Y., Chang, C. M., & Yu, T. J. (2006). Determinants of user acceptance of the e-Government services: The case of online tax filing and payment system. Government Information Quarterly, 23(1), 97-122.
Igbaria, M., Zinatelli, N., Cragg, P., & Cavaye, A. L. (1997). Personal computing acceptance factors in small firms: A structural equation model. MIS Quarterly, 31(3), 279-305. Available at: https://doi.org/10.2307/249498.
Im, I., Kim, Y., & Han, H. J. (2008). The effects of perceived risk and technology type on users’ acceptance of technologies. Information & Management, 45(1), 1-9.
Jöreskog, K. G. (1971). Statistical analysis of sets of congeneric tests. Psychometrika, 36(2), 109-133.
Ketchen, D. (2013). A primer on partial least squares structural equation modeling. Long Range Planning, 46(1–2), 184–185. Available at: https://doi.org/10.1016/j.lrp.2013.01.002.
Kock, N. (2015). Common method bias in PLS-SEM: A full collinearity assessment approach. International Journal of e-Collaboration (ijec), 11(4), 1-10. Available at: 10.4018/ijec.2015100101.
Lian, J.-W. (2015). Critical factors for cloud based e-invoice service adoption in Taiwan: An empirical study. International Journal of Information Management, 35(1), 98-109. Available at: https://doi.org/10.1016/j.ijinfomgt.2014.10.005.
Lin, A., & Chen, N.-C. (2012). Cloud computing as an innovation: Percepetion, attitude, and adoption. International Journal of Information Management, 32(6), 533-540.
Low, C., Chen, Y., & Wu, M. (2011). Understanding the determinants of cloud computing adoption. Industrial Management & Data Systems.
Mell, P., & Grance, T. (2011). The NIST definition of cloud computing. NIST Special Publication 800-145, 2011. Retrieved from: http://csrc.nist.gov/publications/nistpubs/800-145/SP800-145.pdf.
Min, Q., Ji, S., & Qu, G. (2008). Mobile commerce user acceptance study in China: A revised UTAUT model. Tsinghua Science and Technology, 13(3), 257-264.
Nguyen, T. D., Nguyen, T. M., Pham, Q. T., & Misra, S. (2014). Acceptance and use of e-learning based on cloud computing: the role of consumer innovativeness. Paper presented at the In International Conference on Computational Science and Its Applications. Springer, Cham.
Nguyen, T. D., Nguyen, D. T., & Cao, T. H. (2014). Acceptance and use of information system: E-learning based on cloud computing in Vietnam. Paper presented at the In Information and Communication Technology-EurAsia Conference. Springer, Berlin, Heidelberg.
Peterson, R. A. (1994). A meta-analysis of Cronbach's coefficient alpha. Journal of consumer research, 21(2), 381-391.
Ratten, V. (2015). Factors influencing consumer purchase intention of cloud computing in the United States and Turkey. EuroMed Journal of Business, 10(1), 80-97. Available at: https://doi.org/10.1108/emjb-02-2014-0007.
Robinson, J. P., Shaver, P. R., & Wrightsman, L. S. (1991). Criteria for scale selection and evaluation. In J. P. Robinson, P. R. Shaver, & L. S. Wrightsman (Eds.), Measures of personality and social psychological attitudes (pp. 1–15). San Diego, CA: Academic Press.
San Martín, H., & Herrero, Á. (2012). Influence of the user’s psychological factors on the online purchase intention in rural tourism: Integrating innovativeness to the UTAUT framework. Tourism Management, 33(2), 341-350. Available at: https://doi.org/10.1016/j.tourman.2011.04.003.
Shin, D.-H. (2009). Towards an understanding of the consumer acceptance of mobile wallet. Computers in Human Behavior, 25(6), 1343-1354. Available at: https://doi.org/10.1016/j.chb.2009.06.001.
Shin, D.-H. (2013). User centric cloud service model in public sectors: Policy implications of cloud services. Government Information Quarterly, 30(2), 194-203. Available at: https://doi.org/10.1016/j.giq.2012.06.012.
Statista. (2019a). For which of the following purposes do you use cloud services? [Graph]. In Statista. Retrieved from: https://www.statista.com/forecasts/991137/purpose-for-cloud-service-usage-in-the-us.
Statista. (2019b). Do you use any of these cloud storage solutions for private use? [Graph]. In Statista. Retrieved from: https://www.statista.com/forecasts/1011627/popular-cloud-storage-brands-in-the-us.
Sun, Z. X. (2012). Determinants of cloud service: Based on innovation attribute and informationization degree. Paper presented at the In Proceedings of International Conference on Engineering and Business Management (EBM2012).
Tarhini, A., Hone, K., & Liu, X. (2014). The effects of individual differences on e-learning users’ behaviour in developing countries: A structural equation model. Computers in Human Behavior, 41, 153-163. Available at: https://doi.org/10.1016/j.chb.2014.09.020.
Tarhini, A., Hone, K., & Liu, X. (2015). A cross‐cultural examination of the impact of social, organisational and individual factors on educational technology acceptance between B ritish and L ebanese university students. British Journal of Educational Technology, 46(4), 739-755. Available at: https://doi.org/10.1111/bjet.12169.
Taylor, S., & Todd, P. (1995). Assessing IT usage: The role of prior experience. MIS Quarterly, 19(4), 561-570. Available at: https://doi.org/10.2307/249633.
Tomatzky, L. G., & Fleischer, M. (1990). The processes of technological innovatio. Lexington MA: Lexington Books.
Venkatesh, V. (2000). Determinants of perceived ease of use: Integrating control, intrinsic motivation, and emotion into the technology acceptance model. Information Systems Research, 11(4), 342-365. Available at: https://doi.org/10.1287/isre.11.4.342.11872.
Venkatesh, V., & Davis, F. D. (2000). A theoretical extension of the technology acceptance model: Four longitudinal field studies. Management Science, 46(2), 186-204. Available at: https://doi.org/10.1287/mnsc.46.2.186.11926.
Venkatesh, V., Morris, M. G., & Ackerman, P. L. (2000). A longitudinal field investigation of gender differences in individual technology adoption decision-making processes. Organizational Behavior and Human Decision Processes, 83(1), 33-60. Available at: https://doi.org/10.1006/obhd.2000.2896.
Venkatesh, V., & Goyal, S. (2010). Expectation disconfirmation and technology adoption: Polynomial modeling and response surface analysis. MIS Quarterly, 34(2), 281-303. Available at: https://doi.org/10.2307/20721428.
Venkatesh, V., Morris, M. G., Davis, G. B., & Davis, F. D. (2003). User acceptance of information technology: Toward a unified view. MIS Quarterly, 27(3), 425-478. Available at: https://doi.org/10.2307/30036540.
Venkatesh, V., Thong, J. Y., & Xu, X. (2012). Consumer acceptance and use of information technology: Extending the unified theory of acceptance and use of technology. MIS Quarterly, 36(1), 157-178. Available at: https://doi.org/10.2307/41410412.
| Asian Online Journal Publishing Group is not responsible or answerable for any loss, damage or liability, etc. caused in relation to/arising out of the use of the content. Any queries should be directed to the corresponding author of the article. |