Evaluation of Preservice Teachers’ Skills in Solving Non-Routine Mathematical Problems through Various Strategies
Bartin University, Faculty of Education Department of Mathematics and Science Education Mathematics Education Bartin, Turkey.
Abstract
This study aims to investigate how the different solutions, problem-solving strategies, and the number of strategies used by the preservice secondary school mathematics teachers on non-routine mathematical problems change according to grade levels. This study was conducted with 152 preservice teachers studying at the department of elementary mathematics education of a state university located in the Western Black Sea region in Turkey. The purposeful sampling method was used to select the participants. A 12-question test with non-routine problems was used as the data collection tool. Content analysis, one of the qualitative data analysis techniques, was used for analyzing the data. The results indicated that the preservice teachers at each grade level generally proposed single solution and more than half of them had difficulties in finding solutions to the problems. It has been observed that the most used strategies of the preservice teachers are the strategies of reasoning, prediction-control, finding a correlation, formation-testing, systematic listing, drawing, and forming equations in all grade levels.
Keywords:Problem-solving, Problem-solving strategies, Non-routine problems, Problem-solving skills, the ability to use various strategies, Preservice mathematics teachers.
Contribution of this paper to the literature
The contribution of this study is to the literature to investigate how different solutions, problem-solving strategies, and the number of strategies used by preservice secondary school mathematics teachers on solving non-routine mathematical problems change according to grade levels.
1. Introduction
Understanding the mathematical knowledge and drawing the relationship between these pieces of knowledge stands out in the process of problem-solving (Swings & Peterson, 1988, as cited by Karataş and Güven (2003). Mathematical problems can be classified as routine (usual) and non-routine (unusual) problems (Mahlios, 1988). Routine problems are the problems that can be solved by four operations frequently encountered in daily life (Altun, 2014). Routine problems help students understand arithmetic operations, reinforce concepts, and solve non-routine problems. On the other hand, non-routine problems are the problems that force students mentally, the solution cannot be seen immediately and require the use of more than one strategy together. In the solution of such problems, the more important than the solution of the problem are the thoughts and approaches developed in the solution process (Mayer, Sims, & Tajika, 1995). This feature of problems enables students to develop critical and creative thinking skills (Mayer et al., 1995). The solution of non-routine problems requires organizing and classifying data, seeing the relationship among data, performing analysis and synthesis, performing many consecutive operations, using different strategies, and revealing creative thinking (Altun, 2014; Mahlios, 1988; Mayer et al., 1995).
Problem-solving is a complex process that covers a wide range of mental processes and skills. According to Nafees (2011) problem-solving is the process of solving problems through high-level cognitive operations such as visualizing, associating, abstracting, comprehending, reasoning, and analyzing. The problem-solving process provides an opportunity for students to create their formulas and problem-solving strategies. However, this process should be managed well by teachers (Weber, 2008). Therefore, it is very important for the preservice mathematics teachers, who are future teachers, to use problem-solving strategies effectively and gain different perspectives on the problems in educating students (Flowers, 1992, as cited by Behlol, Akbar, and Sehrish (2018). Problem-solving may effectively develop the skills of the students to recognize the main idea in a problem, realize the mistakes, build relations, determine the components and structure and recognize the properties of qualities (Cabanilla-Pedro, Acob-Navales, & Josue, 2014). The problem-solving process consists of four basic phases according to Polya. These four phases complement each other like pieces of a puzzle (Ortiz, 2016). The four-phase conceptual framework of Polya (1957); Polya (1973) explaining the problem-solving process is given in Table 1.
Table-1. Polya (1957); Polya (1973) conceptual framework explaining the problem-solving process. |
| Phases of Problem Solving | |
| Phases | Definition |
| Understanding the problem | It is the phase of understanding what the problem is about and what is asked. It is the first and the most significant phase for the solution. |
| Devising a plan | It is the phase of determining strategies to solve the problem. Knowledge of strategies is important in this phase. |
| Carrying out the plan | It is the phase to implement the chosen strategies, methods, and techniques. In this phase, knowledge of topic and algorithm is important. |
| Looking back at the problem | It is the phase of checking the solution and checking whether the result is logical and correct. Adapting the solution to similar situations is also important in this phase. |
Source: I created the table myself by using the information from Polya (1957); Polya (1973) phases of problem solving. |
These phases also refer to the skills that students need to develop to solve problems successfully (Atteh, Andam, & Obeng-Denteh, 2017; Baykul, 2014; Ortiz, 2016) . It is critical to know the problem-solving strategies during the problem-solving process. Despite the understanding of the problem, not being able to create any strategy for the solution or not having enough strategy knowledge will make the solution of unusual problems especially difficult (Ortiz, 2016). In this context, the relevant literature (Calışkan, Erol, & Selçuk, 2006) revealed that expert problem solvers systematically approach the problem compared to novice problem solvers, use more than one problem-solving strategy and reflect a thorough approach to the problem. On the contrary, it has been revealed that novice problem solvers try to solve the problem with mathematical equations without organizing the information and making a qualitative description of the problem, and do not benefit from problem-solving strategies sufficiently. Fülöp (2015) defined three important components of the problem-solving process in mathematics as discussion, experimental learning, and tasks. If students are asked to learn problem-solving and to improve their ability to use them, problem-solving strategies should be taught actively. Strategies affect and improve students’ learning focus. Also, since strategy instruction is a complex process, instruction should be carried out step by step and over a long period (Fülöp, 2015). Fülöp (2015) stated that students’ understanding of problems, choosing strategies, and algorithm knowledge are not adequate for solving problems, but it is possible to learn and to teach strategies. She also explained that students improved conceptual and algorithmic knowledge by learning strategic thinking.
Two types of strategies that are general and assistive can be mentioned in the process of problem-solving (LeBlanc, 1977) as cited by Bayazit (2013). According to Bayazit and Aksoy (2010) general strategies are related to thoughts and approaches used in problem-solving. On the other hand, assistive strategies are supportive elements that ensure the controlled execution of thoughts and approaches used in solving the problem. There is more than one problem-solving strategy with different names used in the process of problem-solving in the literature. The most common strategies employed in the process of mathematical problem solving are included in this study. General and assistive strategies mostly used in primary and secondary school levels are presented in Table 2 (Bayazit & Aksoy, 2010; Baykul, 2014; Posamentier & Krulik, 1998; Wickelgren, 1974) . The relationship between problem-solving and general and assistive strategies used in the problem-solving process is shown in Figure 1.
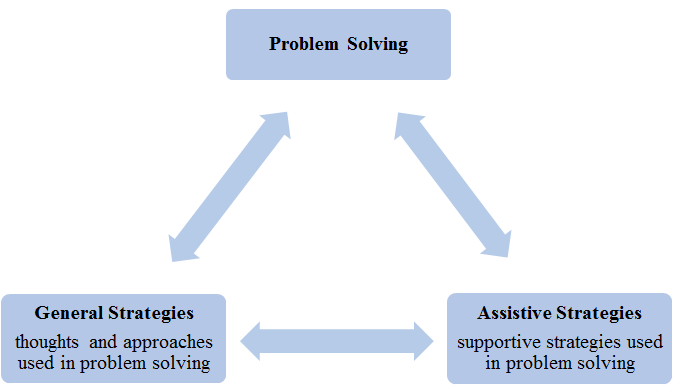
Figure-1. Relationship between problem-solving and general and assistive strategies.
| General Strategies | Assistive Strategies |
|
|
|
|
|
|
|
|
|
|
There are a lot of studies conducted in Turkey (Altun & Sezgin-Memnun, 2008; Aydoğdu, 2014; Bayazit, 2013; Calışkan et al., 2006; Gürbüz & Güden, 2016; Kılıç, 2017; Saygılı, 2017; Taspinar & Bulut, 2012; Türker-Biber, Aylar, Ay, & Akkuş-İspir, 2017; Yazgan, 2007; Yazgan & Arslan, 2017) and abroad (De Hoyos, Gray, & Simpson, 2004; Follmer, 2000; Ishida, 2002; Miller, 2000) about strategies used in the solution of non-routine and real-life problems with students at different grade levels and preservice teachers.
Calışkan et al. (2006) investigated what kind of strategies the preservice physics teachers developed while solving physics problems, and found that senior preservice teachers developed more strategies. Gürbüz and Güden (2016) identified different strategies that secondary school mathematics teachers employed while solving non-routine problems and investigated reasons for this difference. In their study, it was concluded that teachers were partially sufficient in finding the correct results of the problems, but they were insufficient in using different strategies. Altun and Sezgin-Memnun (2008) examined mathematics preservice teachers’ non-routine mathematical problem-solving skills and the solution strategies they used in solving them. Türker-Biber et al. (2017) examined the pedagogical content knowledge of prospective mathematics teachers through classroom observations and interviews. The point that draws attention in the study was that the preservice teachers maintained a closer stance towards problem-solving compared to the conventional approach because of its importance in the teaching process; however, they considered a result-oriented approach to problem-solving. Yavuz (2006) analyzed the effect of teaching problem-solving strategies with secondary school students on students’ mathematics attitudes, mathematics anxiety, and academic selves towards problem-solving and achievements. On the other hand, Taspinar and Bulut (2012) who analyzed solutions that 8th graders developed for routine and non-routine problems by using various strategies with a quasi-experimental design, suggested that the 8th graders showed a different point of view towards problems and that they were able to suggest new solutions after teaching the problem-solving strategies.
Kılıç (2017) who researched on problem-posing situations of primary school preservice teachers by applying their knowledge of problem-solving strategies and the difficulties they experienced in this process, found that the preservice teachers did not have adequate knowledge of problem-solving strategies and problem posing. Also, Aydoğdu (2014) examining problem-solving strategies of primary school preservice mathematics teachers in geometry stated that all preservice teachers used some strategies, yet the male preservice teachers used more strategies compared to the female ones.
Choosing and implementing a suitable strategy for the solution of the problem significantly affects the problem-solving success of the students. Therefore, informing students about problem-solving strategies will positively affect student success. In this context, teachers’ tasks and responsibilities are to help students encounter routine and non-routine problems that can be solved with different strategies and, most importantly, with more than one strategy, to provide them work on these problems and to trigger their motivation to solve the problems by using all possible strategies (Bayazit & Aksoy, 2010). Thus, students can solve the problems with strategies they developed on their own (Yazgan, 2007) and this contributes to the development of problem-solving skills and higher-order thinking skills. Since it is critical in doing mathematics and acquiring mathematical knowledge, it is through teachers to gain problem-solving skills, which is at the center of instructional programs, for this reason, the preservice teachers need to be trained in the best and the most equipped way and have occupational consciousness so that students can learn and implement mathematical concepts, mathematical thinking, inter-conceptual relations, communication and problem solving effectively. At this point, the preservice teachers need to know the subject matter, knowledge of teaching the subject, and pedagogy knowledge. Pedagogical content knowledge (PCK) includes subject matter knowledge, subject teaching knowledge, difficulties that may be encountered in teaching the subject, mistakes made, misconceptions, and pedagogical knowledge (Shulman, 1986).
In studies related to PCK (Ball, Hill, & Bass, 2005; Fedosejeva, Boče, Romanova, Iliško, & Ivanova, 2018; Shulman, 1986) the importance of the knowledge of student recognition and teaching was highlighted. Knowledge of teaching contains the tasks teachers need to complete in making a subject meaningful for the students (Ball, Thames, & Phelps, 2008). The professional knowledge of a teacher directly affects the quality of learning and teaching processes (Baki, 2014). In this context, for the teacher to perform meaningful learning based on the knowledge of the subject matter, it is important for the students to have knowledge about how they learn better and to make the students aware of the mistakes they make during the learning process and to correct them. The fact that mathematics teachers have a relational and in-depth structure of their mathematics knowledge is important for the effectiveness of mathematics teaching (Ball et al., 2005). Teaching methods and strategies that the teachers employ to shape the students’ learning of mathematics (Baykul, 2014). When teachers focus on logical reasoning and higher-level thinking skills in the teaching process, students' learning mathematics reaches the highest level (National Council of Teachers of Mathematics (NCTM), 2000). When all of these facts are considered, as teachers of the future-preservice teachers’ knowing problem-solving strategies and solving a problem with more than one strategy becomes a research subject. As teachers are particularly the ones to develop these skills in students, it is important to investigate whether the preservice teachers’ such skills are adequate or not.
In Polya (1957) phases of the problem-solving process, it can be seen that gaining various strategies and systematics of problem-solving based on the content is more important than rules and formulas (Ipek & Okumus, 2012; Ortiz, 2016). It can be possible to help students gain problem-solving skills and learn problem-solving systematics by providing them an environment in which they can generate their problem-solving strategies and use strategies as different as possible. In this context, the strategies used by the preservice teachers in solving non-routine problems and the number of strategies become significant.
1.1. The Aim of the Study
In the literature related to problem-solving strategies, no qualitative studies analyzing the number of different solutions that preservice mathematics teachers proposed, strategies they used in solving problems, the number of strategies they employed, and their grade levels were found. Since the problem-solving skill is a basic skill in the curriculum required to be gained by the students, it is essential to determine the strategies, the variety of strategies, and the number of strategies used by the preservice teachers who will carry out this profession in the future in solving non-routine mathematical problems. Therefore, this study aims to investigate how different solutions, problem-solving strategies, and the number of strategies used by preservice secondary school mathematics teachers on solving non-routine mathematical problems change according to grade levels. The following sub-problems are answered for this aim.
- How many different ways do preservice secondary school mathematics teachers use for solving non-routine mathematical problems?
- What solving strategies do preservice secondary school mathematics teachers apply most while solving non-routine mathematical problems?
- What is the number of strategies used for solving non-routine mathematical problems by preservice secondary school mathematics teachers according to grade levels?
2. Methodology
2.1. Research Design
Since the study aimed to thoroughly analyze various strategies developed by the preservice secondary school mathematics teachers while solving non-routine mathematical problems, the case study method, which is based on a qualitative approach and which allows handling and interpret a phenomenon, topic, and event by elaborating, was employed (Creswell, 2013; Merriam, 2013). It was investigated whether the preservice teachers used one or more than one solution while solving a problem and whether the ones using one solution used more than one strategy in single solution.
2.2. Study Group
This study was conducted with 152 preservice teachers (118 females and 34 males) studying at the department of elementary mathematics education of a state university located in the Western Black Sea Region of Turkey in the 2017-2018 academic year. The purposeful sampling method was used to select the participants. In this context, it was paid attention to select the participants from the students studying at the department of elementary mathematics education. The number and percentages of the preservice teachers according to the grade levels are presented in Table 3. Instead of using the real names of participants, S11, S12…S148 were used for the first graders; S21, S22,…S224 were used for the second graders; S31, S32,…S334 were used for the third graders, and S41, S42,…S437 were used for the fourth graders.
Table-3. Frequency and percentage of the distribution of the preservice secondary school teachers according to grade levels. |
| Grade Levels | n |
% |
| 1st Graders | 48 |
31.58 |
| 2nd Graders | 33 |
21.71 |
| 3rd Graders | 34 |
22.37 |
| 4th Graders | 37 |
24.34 |
| Sum n | 152 |
100 |
2.3. Data Collection Tools and Analysis
A 12-question test including non-routine problems prepared using local (Yazgan & Arslan, 2017) and foreign mathematics teaching sources (Posamentier & Krulik, 1998; Posamentier & Krulik, 2008; Posamentier & Krulik, 2009) and secondary school mathematics textbooks were used as the data collection tool. The prepared questions were assessed by two experts in terms of some criteria such as aim, content, and time allocation. Each problem was named by the researcher so that the research questions can be easily understood in the following sections of the article. The research questions are given in Table 4.
| 1) | The area of a rectangle is 120 cm2. Its width and length are integers. What are the alternatives for these two numbers? Which alternative gives the smallest perimeter? (Problem about the perimeter of rectangles) | 2) | If a cake with the size of 8x8 cm is served to 4 people equally, how many cakes with the size of 12x12 cm are needed for serving to 18 people equally? (Problem about cakes) | ||||||||||||
| 3) |
|
4) | Elif has a frog named Minik. Minik can leap away 1 or 2 meters in one go. How many different ways can it leap away 7 meters? (Problem about frogs) | ||||||||||||
| 5) |
|
6) | A census taker goes to a house for taking a census and asks the housewife about the number of people living in that house and their ages. The woman tells him that three girls are living in that house. She also tells that product of their ages is 36, and the sum of their ages is equal to the door number of their neighbor’s apartment. The census taker goes to the neighbor’s apartment and looks at the door number. He comes back and tells that the information given is not enough. Then, the woman says that “My eldest daughter has ginger hair”. After that, the census taker thanks and calculates the girls’ ages. How old are the girls, and how can the census taker know this? (Problem about census takers) | ||||||||||||
| 7) | A palindrome number is a number that remains the same when its digits are reversed. 747 and 1991 are examples of palindrome numbers. So, how many palindrome numbers are there between 1 and 1000? (Problem about palindromic numbers) | 8) | A sequence continuing as 1,2,2,3,3,3,4,4,4,4,5,5,5,5,5,… has been formed by writing each positive n integer n times. How many terms are needed for making the sum of multiplicative inverses of the terms 500? (Problem about sequence) | ||||||||||||
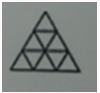
| 9) | A system as follows is used for the roof of a mall. Three metal bars and 3 pins are used for creating a triangle while 5 metal bars and 4 pins are used for creating two triangles. When it is continued similarly, how many bars and pins are required for 10 triangles?
|
10) | There are 100 cookies shared by 100 masters and apprentices. While each master takes 3 cookies, 3 of the apprentices share one cookie. How many masters are there? (Problem about masters-apprentices) | ||||||||||||
| 11) | While the length of two sides of a square is increased by 25%, the length of the other two sides is decreased by 40%. Find the rate of decrease in the area of the square. (Problem about the area of squares) | ||||||||||||||
| 12) | How many different isosceles triangles whose sides are integers and whose perimeter is 113 units are possible? (Problem about isosceles triangles) |
Qualitative data analysis techniques were used for analyzing the data. A content analysis was employed by using categories and codes created by the researcher, and an expert in the analysis of the data obtained from the study. These categories and codes were presented in Table 5. The percentage of agreement in the coding (Miles & Huberman, 1994) was found at 86%. The researcher and the expert reached an agreement as a result of their discussions for the remaining 14% difference. The data obtained from the preservice teachers’ answers were classified by the categories and codes defined, and they were presented in the section of findings by giving their frequencies and by supporting them with examples. To make categories given in Table 5 comprehensible, they were explained as follows; The Preservice Teachers Proposing Single Solution: They are the preservice teachers solving the problems using one-way of solution. The Preservice Teachers Proposing More Than One Solution: They are the ones who solve the problems with more than one strategy and who find different solutions for the problems.
Table-5. The codes and categories regarding the strategies used by the preservice teachers in solving problems. |
| Categories Codes | Number of strategies used by the preservice teachers proposing single solution | Total f (%) | Number of strategies used by the preservice teachers proposing more than one solution | Total f (%) | Grand Total f (%) | ||
| Single Strategy | More than One Strategy | Single Strategy | More than One Strategy | ||||
| Problem-solving strategies | |||||||
3. Findings and Interpretation
In this section of the study, the findings regarding the preservice teachers’ solutions for non-routine problems were included.
3.1. Findings Related to the First Sub-Problem
The findings related to the first sub-problem “How many different ways do preservice secondary school mathematics teachers use for solving non-routine mathematical problems?” were given in Table 6 according to grade levels.
When Table 6 was analyzed as a whole, it was seen that the preservice teachers at each grade level solved non-routine mathematical problems mostly with single solution. The preservice teachers in the third and fourth-grade levels proposed two solutions more than the ones in the first and second-grade levels. When the number of solutions to solve non-routine mathematical problems in Table 6 was analyzed, it was seen that the preservice teachers in the first and second-grade levels could not propose more than two solutions except for 1 preservice teacher.
Table 7 shows the number of correct answers that the preservice teachers gave for each way of solution and percentage distributions. Also, the total number of preservice teachers in all grade levels was 152, and the number of non-routine problems was 12. In Table 7, the minimum and the maximum number of answers that can be given was calculated with the formula of “the number of answers that can be given at minimum (maximum) x the total number of problems x the number of solutions proposed”. For instance, the range of the number of correct answers is 0≤number of answers≤1824 (152x12x1) for one solution. It was understood from Table 7 that the number of correct answers given by the preservice teachers for one solution was 838, and this result formed 46.79% of the answers in the range of one solution; the number of correct answers given by the preservice teachers for two solutions was 258, and this result formed 7.20% of the answers in the range of two solutions; the number of correct answers given by the preservice teachers for more than two solutions was 27, and this result formed 0.50% of the answers in the range of three solutions. Therefore, it was seen that 129 preservice teachers proposed two solutions with 258 answers, and 9 preservice teachers proposed more than two solutions with 27 answers. 8 of the preservice teachers proposing more than two solutions were at the fourth and third-grade level while 1 of them was at the second-grade level. Since no preservice teachers proposed more than three solutions, the ones proposing more than two solutions were considered as the ones proposing three solutions.
3.2. Findings and Interpretation Related to the Second Sub-Problem
The findings related to the second sub-problem “What solving strategies do preservice secondary school mathematics teachers apply most while solving non-routine mathematical problems?” were given in tables according to grade levels. In this section, the findings were supported with examples of the preservice teachers’ answers; however, all of the problems could not be supported with examples. For this reason, examples of the preservice teachers who mostly propose two or more solutions and give different answers were included. The meanings of the abbreviations and formulas used in the tables are given as follows.
NSPOS: Number of strategies used by the preservice teachers proposing one solution.
NSPMTOS: Number of strategies used by the preservice teachers proposing more than one solution.
SL: Systematic Listing, DP: Drawing Picture, WE: Writing Equations, SP: Simplifying the Problem.
WMS: Writing Mathematical Statements, MT: Making Table, R: Reasoning, FP: Finding patterns.
GT: Generating and Testing, GC: Guess-Check, f: number of strategies used.
Ʃf: total number of strategies used in the relevant category.
Ʃf (%): total number of strategies and percentage in the relevant category among the strategies used for each problem.
In Table 8, Table 9, Table 10, and Table 11, the frequencies and percentage distributions related to how many different solutions were used and to what strategies employed together or separately for each problem by the preservice teachers were presented in detail. When the findings obtained from the tables were analyzed, it was seen that the most-used assistive strategies by the preservice teachers were drawing a picture, writing equations, making a systematic list. Whereas, the most-used general strategies were reasoning, finding patterns, generating-testing, and guess-check. Some examples from the answers of the preservice teachers supporting the findings obtained from Table 8, Table 9, Table 10 and Table 11 were given below. The answers of the preservice teachers were explained thoroughly in the examples of the preservice teachers at each grade level.
Table-6. Number of strategies used to solve non-routine mathematical problems by the preservice secondary school mathematics teachers. |
4th Graders |
3rd Graders |
2nd Graders |
1st Graders |
|||||||||||||
Item No |
SS |
TS |
MTS |
WS |
SS |
TS |
MTS |
WS |
SS |
TS |
MTS |
WS |
SS |
TS |
MTS |
WS |
1 |
26 |
7 |
4 |
- |
26 |
4 |
2 |
2 |
20 |
5 |
- |
8 |
35 |
7 |
- |
6 |
2 |
20 |
4 |
- |
13 |
16 |
10 |
1 |
7 |
14 |
8 |
- |
11 |
31 |
- |
- |
17 |
3 |
17 |
11 |
- |
9 |
12 |
15 |
1 |
6 |
10 |
7 |
- |
16 |
31 |
9 |
- |
8 |
4 |
11 |
1 |
- |
25 |
2 |
1 |
- |
31 |
1 |
- |
- |
32 |
7 |
2 |
- |
39 |
5 |
30 |
- |
- |
7 |
14 |
- |
- |
20 |
11 |
- |
- |
22 |
21 |
- |
- |
27 |
6 |
8 |
- |
- |
29 |
7 |
- |
- |
27 |
9 |
- |
- |
24 |
9 |
- |
- |
39 |
7 |
14 |
1 |
- |
22 |
16 |
1 |
- |
17 |
7 |
- |
- |
26 |
10 |
- |
- |
38 |
8 |
19 |
- |
- |
18 |
17 |
- |
- |
17 |
7 |
- |
- |
26 |
16 |
- |
- |
32 |
9 |
29 |
4 |
- |
4 |
26 |
8 |
- |
- |
12 |
4 |
1 |
16 |
42 |
3 |
- |
3 |
10 |
28 |
6 |
- |
3 |
22 |
3 |
- |
9 |
20 |
1 |
- |
12 |
41 |
- |
- |
7 |
11 |
28 |
2 |
- |
7 |
25 |
4 |
- |
5 |
9 |
1 |
- |
23 |
35 |
- |
- |
13 |
12 |
12 |
- |
- |
25 |
6 |
- |
- |
28 |
- |
- |
- |
- |
9 |
- |
- |
39 |
Sum |
242 |
36 |
4 |
162 |
189 |
46 |
4 |
169 |
120 |
26 |
1 |
216 |
287 |
21 |
- |
268 |
NCA |
242 x1 |
36x2 |
4x3 |
0 |
189 x1 |
46x2 |
4x3 |
0 |
120 x1 |
26x2 |
1x3 |
0 |
287 x1 |
21x2 |
0 |
0 |
Note: SS: number of preservice teachers proposing single solution, TS: number of preservice teachers proposing two solutions, -: no data in the relevant category, MTS: number of preservice teachers proposing more than two solutions, WS: number of preservice teachers without any solutions NCA: number of correct answers. |
Table-7. Number of correct solutions proposed by the preservice teachers and percentage distributions. |
| Number of solutions proposed for solving the problems | Number of preservice teachers |
Min. number of answers |
Max. number of answers |
Number of correct answers |
% |
| One | 152 |
0 |
1824 |
838 |
46.79 |
| Two | 152 |
0 |
3648 |
258 |
7.20 |
| Three | 152 |
0 |
5472 |
27 |
0.50 |
Table-8 . The strategies used to solve non-routine mathematical problems by the preservice mathematics teachers at the fourth grade level, related frequencies and percentage distributions. |
Item No |
Codes | Categories | NSPOS (f) |
Ʃf (%) |
NSPMTOS (f) |
Ʃf(%) |
Overall Ʃf (%) |
||
Single Strategy |
More than One Strategy |
Single Strategy |
More than One Strategy |
||||||
1 |
MSL | - |
16 |
16(23.88) |
2 |
6 |
8(21.62) |
24(23.07) |
|
| DP | - |
25 |
25(37.31) |
2 |
10 |
12(32.43) |
37(35.58) |
||
| MT | - |
1 |
1(1.49) |
2 |
- |
2(5.40) |
3(2.88) |
||
| WMS | - |
2 |
2(2.98) |
- |
1 |
1(2.70) |
3(2.88) |
||
| R | - |
19 |
19(28.36) |
4 |
3 |
7(19.00) |
26(25) |
||
| GC | - |
4 |
4(5.98) |
3 |
4 |
7(19.00) |
11(10.58) |
||
2 |
DP | 1 |
17 |
18(45) |
3 |
1 |
4(44.44) |
22(44.90) |
|
| GT | 1 |
7 |
8(20) |
3 |
- |
3(33.33) |
11(22.45) |
||
| R | - |
14 |
14(35) |
1 |
1 |
2(22.22) |
16(32.65) |
||
3 |
DP | - |
6 |
6(26.08) |
10 |
- |
10(47.61) |
16(36.36) |
|
| MT | - |
1 |
1(4.34) |
- |
- |
- |
1(0.23) |
||
| FP | 10 |
6 |
16(69.56) |
10 |
- |
10(47.61) |
26(59.09) |
||
| GT | - |
- |
- |
1 |
- |
1(4.77) |
1(0.23) |
||
4 |
DP | - |
5 |
5(25) |
1 |
- |
1(33.33) |
6(26.08) |
|
| MSL | - |
5 |
5(25) |
1 |
- |
1(33.33) |
6(26.08) |
||
| MT | - |
2 |
2(10) |
- |
- |
- |
2(8.70) |
||
| R | - |
1 |
1(5) |
- |
- |
- |
1(4.35) |
||
| GT | - |
7 |
7(35) |
1 |
- |
1(33.33) |
8(37.78) |
||
5 |
FP | 27 |
3 |
30(90.90) |
- |
- |
- |
30(90.90) |
|
| MT | - |
3 |
3(9.09) |
- |
- |
- |
3(9.09) |
||
6 |
GT | - |
5 |
5(31.25) |
- |
- |
- |
5(31.25) |
|
| MSL | - |
3 |
3(18.75) |
- |
- |
- |
3(18.75) |
||
| R | - |
8 |
8(50) |
- |
- |
- |
8(50) |
||
7 |
MT | - |
1 |
1(6.66) |
- |
- |
- |
1(5.88) |
|
| MSL | 12 |
1 |
13(86.66) |
1 |
- |
1 |
14(64.70) |
||
| GC | 1 |
1(6.66) |
1(5.88) |
||||||
| FP | - |
- |
- |
- |
1 |
1 |
1(5.88) |
||
8 |
FP | 1 |
17 |
18(36.73) |
- |
- |
- |
18(36.73) |
|
| GT | - |
19 |
19(38.78) |
- |
- |
- |
19(38.78) |
||
| WE | - |
12 |
12(24.49) |
- |
- |
- |
12(24.49) |
||
9 |
MT | - |
4 |
4(11.42) |
- |
1 |
1 (12.50) |
5(10.87) |
|
| FP | 21 |
7 |
28(80) |
2 |
1 |
3 (37.50) |
31(67.40) |
||
| DP | - |
- |
- |
3 |
- |
3 (37.50) |
6(13.04) |
||
| MSL | - |
3 |
3(8.57) |
1 |
- |
1 (12.50) |
4(86.96) |
||
10 |
GC | 2 |
- |
2(6.66) |
2 |
2 |
4 (28.57) |
6(13.63) |
|
| WE | 24 |
- |
24(80) |
6 |
- |
6 (42.85) |
30(68.18) |
||
| MT | - |
1 |
1(3.33) |
- |
- |
- |
1(2.27) |
||
| GT | 1 |
1 |
2(6.66) |
1 |
- |
1 (7.14) |
3(6.81) |
||
| MSL | 1 |
- |
1(3.33) |
- |
1 |
1 (7.14) |
2(4.54) |
||
| R | - |
- |
- |
- |
2 |
2 (14.28) |
2(4.54) |
||
11 |
DP | - |
28 |
28(38.35) |
- |
1 |
1 (14.28) |
29(36.25) |
|
| WE | - |
1 |
1(1.36) |
- |
2 |
2 (28.57) |
3(3.75) |
||
| GT | - |
19 |
19(26.02) |
- |
2 |
2 (28.57) |
21(26.25) |
||
| R | - |
25 |
25(14.25) |
- |
1 |
1 (14.28) |
26(32.50) |
||
| GC | - |
- |
- |
- |
1 |
1 (14.28) |
1(1.25) |
||
12 |
DP | - |
11 |
11(34.37) |
- |
- |
- |
11(34.37 |
|
| GC | 1 |
10 |
11(34.37) |
- |
- |
- |
11(34.37 |
||
| GT | - |
10 |
10(31.25) |
- |
- |
- |
10(31.25) |
||
According to Table 8, when the strategies used by fourth-grade preservice teachers in solving non-routine problems were evaluated in general, the most-used assistive strategies were drawing a picture, writing equations, making a systematic list while general strategies were reasoning, finding patterns and generating-testing.
The preservice teachers at the fourth-grade level used drawing a picture in about 36% of all strategies used for the first problem which was about the perimeter of rectangles while they used making a systematic list in 23% of them. The examples showing the strategies used for solving the problem about the perimeter of the rectangle by S47 and S417 who proposed more than one solution and their correct answers regarding the solution were included in Figure 2. According to the figure, S47 carried out the first solution by using the strategies of guess-check which he called trial-error and making table together, and he carried out the second solution by using the strategies of reasoning and drawing a picture. On the other hand, S417 found the smallest perimeter by using the strategy of making a systematic list in the first solution by finding the numbers whose products were 120 and the sums of those numbers. Furthermore, he used the strategy of reasoning in the second way of the solution by considering that two nearest numbers product of whose side lengths were 120 would give the smallest perimeter.
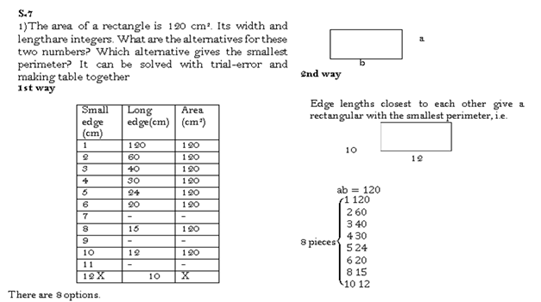
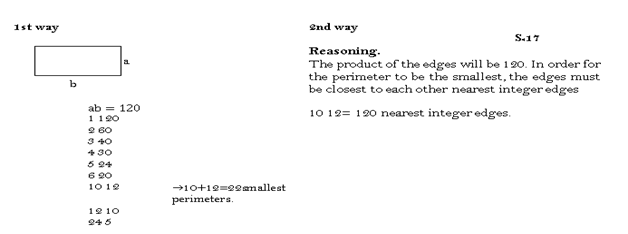
Figure-2. Strategies used to solve the problem about the perimeter of rectangles by S47 and S417 and their correct answers. |
In Figure 3, the strategies used to solve the problem about cake by S425 and the example showing more than one solution were illustrated.
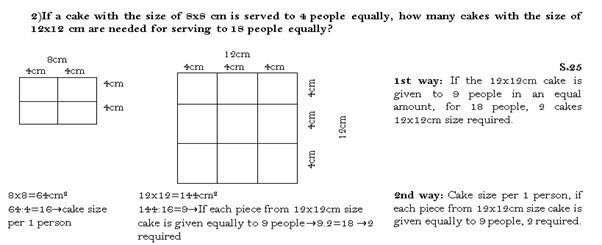
Figure-3. The strategies and correct answer of S425 regarding the problem about cakes. |
In Figure 4, the strategy used for the problem about frogs by S418 proposing single solution, and the example showing his correct answer were presented. S418 proposed single solution by using the strategies of making a table and generating-testing together for this problem. S418 firstly showed situations to happen with the frog’s one meter and then two meters of leaping away in the table and found the number of different ways of its leaping away by using the formula of repeated permutation.
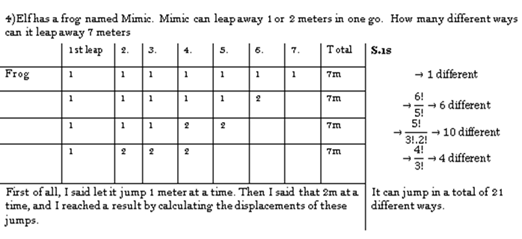
Figure-4. The strategies and correct answer of S418 regarding the problem about frogs. |
The preservice teachers at the fourth-grade level had the most difficulty in the sixth problem which was about census takers, and it was the non-routine problem for which they could not propose more than one solution. The explanations of the preservice teachers who were not able to solve this problem accurately were generally that “there is missing information in the problem, it is not possible to know the answer with these data, or I could not relate/understand ginger hair with age”. This showed that the preservice teachers were not able to analyze the problem adequately and to correlate between the data, so they could not use reasoning sufficiently. S411 proposed single solution for this problem by employing the strategies of making a systematic list and reasoning together. S411 wrote the sums of the numbers whose products were 36 by using the strategy of making a systematic list and concluded by interpreting the data with the strategy of reasoning. Accordingly, the preservice teacher found two results whose products were 36 and sums were 13. He reached the correct answer by deducing that the other sisters were twins from the expression of “my eldest sister”. Similarly, S431 proposed single solution by using the strategy of reasoning. In Figure 5, the strategies used for the problem about census takers by S411 and S431 proposing single solution, and the examples showing their correct answers were given.
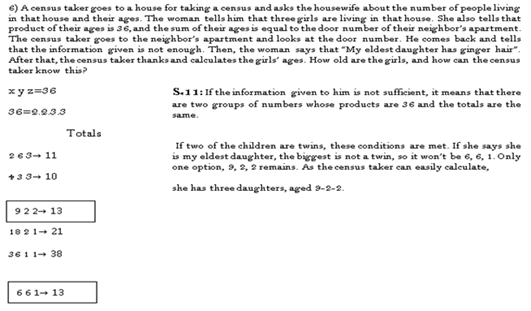
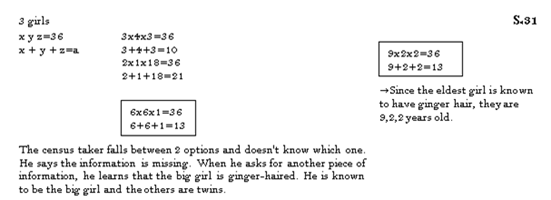
Figure-5. The strategies and correct answers of S411 and S431 regarding the problem about census takers |
In Figure 6, the correct solution proposed by employing the strategy of making a systematic list by S427 was given as an example.
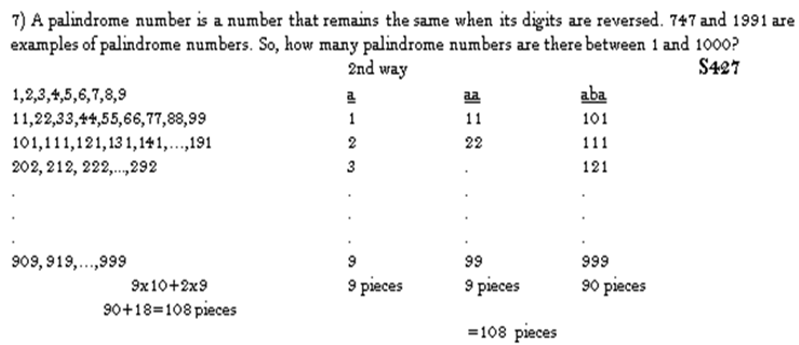
Figure-6. The strategy and correct answer of S427 regarding the problem about palindromic numbers
S415’s solution in Figure 7 revealed that he used the strategies of making a systematic list and making a table, yet he ignored some numbers to be written at tens digit while determining three-digit palindromic numbers. Thus, he was not able to reach the correct solution.
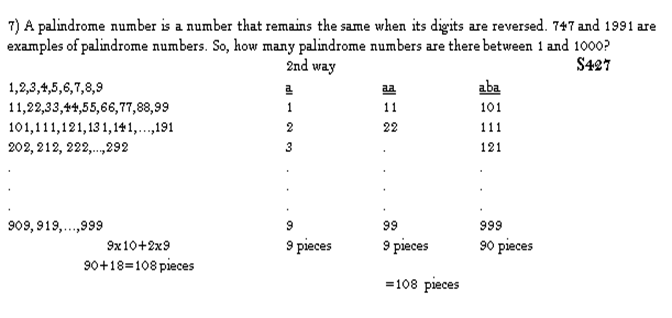
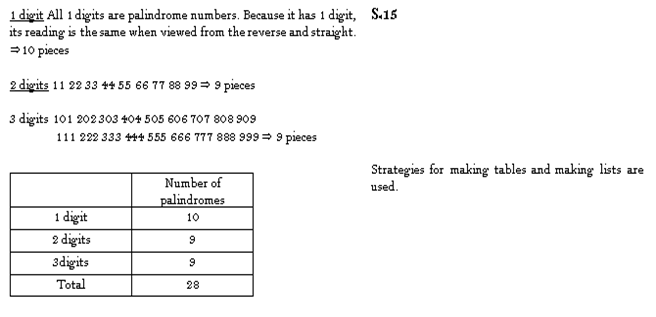
Figure-7. The strategies and incorrect answer of S415 regarding the problem about palindromic numbers |
Approximately 51% of the preservice teachers at the fourth-grade level either did not find the correct answer or did not write any answer for the non-routine problem about the isosceles triangle which was one of the most difficult questions for them. The preservice teachers who were able to solve the problem proposed single solution by using the strategies of drawing a picture, guess-check, and generating-testing together in various combinations. There were not any preservice teachers at the fourth-grade level who could solve the twelfth problem with more than one solution. In Figure 8, the strategies used for the problem about the isosceles triangle by S411 and S419, and the example showing their correct answers were presented.
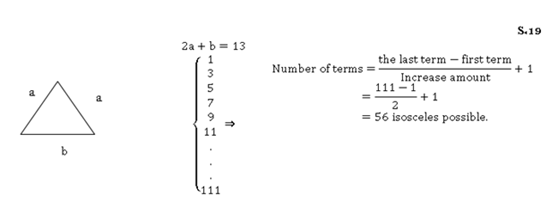
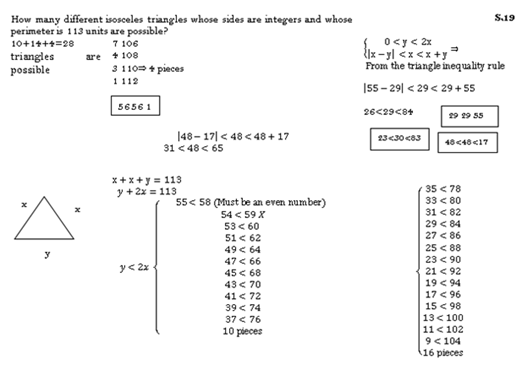
Figure-8. The strategies and correct answers of S411 and S419 regarding the problem about isosceles triangles. |
According to Table 9, the most-used assistive strategies for solving non-routine problems were drawing a picture, writing equations, and making a systematic list while general strategies were reasoning, finding patterns, guess-check, and generating and testing.
The preservice teachers at the third-grade level used guess-check in about 33% of all strategies used for the first problem which was about the perimeter of rectangles while they used to draw a picture in 29% and making a systematic list in 19% of them. In the example in Figure 9, different solutions proposed by S324 employing different strategies were given.
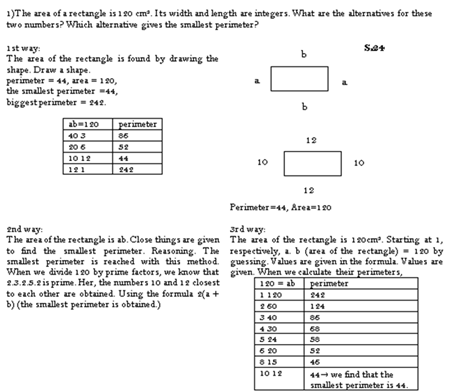
Figure-9. The strategies and correct answer of S324 regarding the problem about the perimeter of rectangles. |
Table-9. The strategies used to solve non-routine mathematical problems by the preservice mathematics teachers at the third grade level, related frequencies and percentage distributions. |
Item No |
Codes | Categories | NSPOS (f) |
Ʃf (%) |
NSPMTOS (f) |
Ʃf (%) |
Overall Ʃf (%) |
||
Single Strategy |
More than One Strategy |
Single Strategy |
More than One Strategy |
||||||
1 |
MSL | - |
10 |
10(16.66) |
1 |
5 |
6(25) |
16(19.04) |
|
| DP | - |
19 |
19(31.66) |
- |
5 |
5(20.83) |
24(28.57) |
||
| MT | - |
- |
- |
- |
1 |
1(4.16) |
1(1.20) |
||
| R | - |
10 |
10(16.66) |
1 |
4 |
5(20.83) |
15(17.85) |
||
| GC | - |
21 |
21(35) |
- |
7 |
7(29.16) |
28(33.33) |
||
2 |
DP | 3 |
11 |
14(51.85) |
1 |
10 |
11(31.43) |
25(40.32) |
|
| GT | - |
4 |
4(14.81) |
3 |
6 |
9(25.71) |
13(20.97) |
||
| R | 1 |
8 |
9(33.33) |
1 |
11 |
12(34.28) |
21(33.87) |
||
| WE | - |
- |
- |
2 |
- |
2(5.71) |
2(3.22) |
||
| GC | - |
- |
- |
1 |
- |
1(2.86) |
1(1.61) |
||
3 |
DP | 5 |
- |
5(41.66) |
14 |
- |
14(41.17) |
19(41.30) |
|
| R | - |
- |
- |
- |
2 |
2(5.88) |
2(4.34) |
||
| FP | 7 |
- |
7(58.33) |
15 |
- |
15(44.11) |
22(47.83) |
||
| WE | - |
- |
- |
1 |
2 |
3(8.82) |
3(6.52) |
||
4 |
DP | - |
- |
- |
1 |
- |
1(50) |
1(25) |
|
| MSL | 1 |
- |
1(50) |
- |
- |
- |
1(25) |
||
| R | 1 |
- |
1(50) |
- |
- |
- |
1(25) |
||
| GT | - |
- |
- |
1 |
- |
1(50) |
1(25) |
||
5 |
FP | 14 |
- |
14(100) |
- |
- |
- |
14(100) |
|
6 |
SP | - |
2 |
2(20) |
- |
- |
- |
2(20) |
|
| GC | 2 |
2 |
4(40) |
- |
- |
- |
4(40) |
||
| R | 3 |
1 |
4(40) |
- |
- |
- |
4(40) |
||
7 |
MSL | 2 |
14 |
16(53.33) |
1 |
- |
1(50) |
17(53.13) |
|
| R | - |
14 |
14(46.66) |
1 |
- |
1(50) |
15(46.87) |
||
8 |
FP | - |
17 |
17(38.63) |
- |
- |
- |
17(38.63) |
|
| GT | - |
17 |
17(38.63) |
- |
- |
- |
17(38.63) |
||
| WE | - |
10 |
10(22.72) |
- |
- |
- |
10(22.72) |
||
9 |
MT | - |
1 |
1(3.70) |
- |
1 |
1(6.66) |
2(4.76) |
|
| FP | 22 |
1 |
23(85.18) |
8 |
- |
8(53.33) |
31(73.81) |
||
| DP | 3 |
- |
3(11.11) |
6 |
- |
6(40) |
9(21.43) |
||
10 |
GC | 5 |
- |
5(23.81) |
2 |
- |
2(33.33) |
7(25.93) |
|
| WE | 15 |
- |
15(71.42) |
3 |
- |
3(50) |
18(66.66) |
||
| GT | 1 |
- |
1(4.76) |
- |
- |
- |
1(3.70) |
||
| R | - |
- |
- |
1 |
- |
1(16.66) |
1(3.70) |
||
11 |
DP | - |
24 |
24(48.98) |
- |
5 |
5(31.25) |
29(44.61) |
|
| WE | - |
2 |
2(4.08) |
- |
2 |
2(12.50) |
4(6.15) |
||
| GT | - |
- |
- |
- |
4 |
4(25) |
4(6.15) |
||
| R | - |
23 |
23(46.93) |
- |
5 |
5(31.25) |
28(43.07) |
||
12 |
MSL | - |
1 |
1(6.66) |
- |
- |
- |
1(6.66) |
|
| DP | - |
5 |
5(33.33) |
- |
- |
- |
5(33.33) |
||
| GC | 1 |
1 |
2(13.33) |
- |
- |
- |
2(13.33) |
||
| GT | - |
4 |
4(26.66) |
- |
- |
- |
4(26.66) |
||
| R | - |
3 |
3(20) |
- |
- |
- |
3(20) |
||
More than one solution proposed by using the strategies of drawing a picture and reasoning by S324 was given as an example in Figure 10. The solutions of S324 were similar to the solutions of the preservice teachers at the fourth grade level regarding this problem.
The strategies of drawing a picture, writing equations, and finding patterns which were employed to solve the problem about playing cards by S36 and his solutions were given in the example in Figure 11.
The problem about census taker was one of the most difficult non-routine problems for the preservice teachers at the third-grade level so that 79% of them either did not answer this problem correctly or left it unanswered. The only single solution was proposed for this problem by using the strategies of reasoning, guess-check, and simplifying the problem. The single solution using the strategies of reasoning, guess-check, and simplifying the problem by S31 was given in Figure 12. On the other hand, the preservice teachers who could not find the right solution to this problem were generally unable to perform the reasoning required for the solution of the problem and could not solve the problem by using the expressions “there is missing information in the problem, there is no relation of ginger hair with age or this is not a mathematical expression”. An example showing S37’s answer which was related to this situation was included in Figure 13.
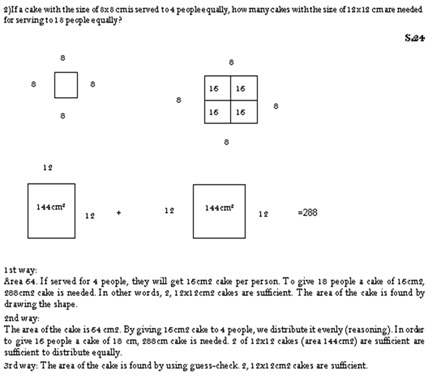
Figure-10. The strategies and correct answer of S324 regarding the problem about cakes. |
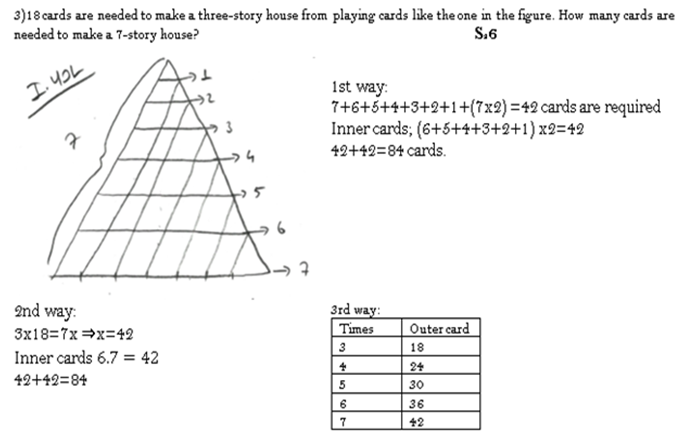
Figure-11. The strategies and correct answer of S36 regarding the problem about playing cards. |
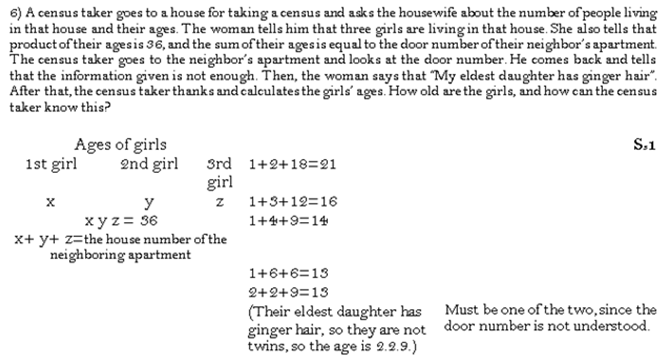
Figure-12. The strategies and correct answer of S31 regarding the problem about census takers |
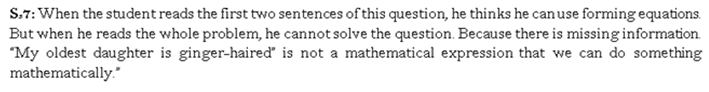
Figure-13. The incorrect answer of S37 regarding the problem about census takers.
According to the findings obtained from the twelfth problem, which was about isosceles triangles where only 6 (17.65%) of third grade preservice teachers could find the right solution by using more than one strategy, the preservice teachers who solved the problem correctly proposed single solution by employing more than one strategy together. About 82% of the preservice teachers could not answer correctly this problem which was not solved with more than one solution by any preservice teachers. An example from S31 who answered this problem correctly was given in Figure 14. In this example, S31 first drew an isosceles triangle by defining side lengths and then wrote a triangle inequality by using the information that a triangle should be drawn and found that one of the equal side lengths should be an integer between 29 and 56. In light of the information given, he found how many different isosceles triangles can be drawn using the total formula. S31 proposed single solution by using the strategies of drawing a picture and generating-testing together.
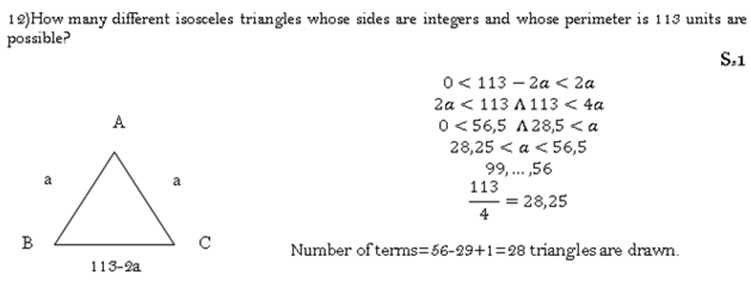
Figure-14. The strategies and correct answer of S31 regarding the problem about isosceles triangles. |
Table-10 . The Strategies used to solve non-routine mathematical problems by the preservice mathematics teachers at the second grade level, related frequencies and percentage distributions. |
Item No |
Codes | Categories | NSPOS (f) |
Ʃf (%) |
NSPMTOS (f) |
Ʃf (%) |
Overall Ʃf (%) |
||
Single Strategy |
More than One Strategy |
Single Strategy |
More than One Strategy |
||||||
1 |
MSL | 4 |
12 |
16(45.71) |
3 |
2 |
5(50) |
21(46.66) |
|
| DP | - |
12 |
12(34.29) |
- |
2 |
2(20) |
14(31.11) |
||
| R | 1 |
3 |
4(11.43) |
2 |
1 |
3(30) |
7(15.15) |
||
| GC | 2 |
1 |
3(8.57) |
- |
- |
- |
3(6.66) |
||
2 |
DP | 3 |
1 |
4(22.22) |
- |
5 |
5(23.80) |
9(23.07) |
|
| GT | 7 |
3 |
10(55.55) |
8 |
- |
8(38.09) |
18(46.15) |
||
| R | - |
4 |
4(22.2 2) |
3 |
5 |
8(38.09) |
12(30.77) |
||
3 |
DP | 1 |
- |
1(10) |
7 |
- |
7(50) |
8(33.33) |
|
| FP | 9 |
- |
9(90) |
7 |
- |
7(50) |
16(66.66) |
||
4 |
MSL | 1 |
- |
1 |
- |
- |
- |
1(100) |
|
5 |
FP | 11 |
- |
11(100) |
- |
- |
- |
11(100) |
|
6 |
MSL | - |
9 |
9(50) |
- |
- |
- |
9(50) |
|
| R | 9 |
9(50) |
- |
- |
- |
9(50) |
|||
7 |
MSL | 7 |
1 |
8(88.88) |
- |
- |
- |
8(88.88) |
|
| GT | - |
1 |
1(11.11) |
- |
- |
- |
1(11.11) |
||
8 |
FP | - |
7 |
7(33.33) |
- |
- |
- |
7(33.33) |
|
| GT | - |
7 |
7(33.33) |
- |
- |
- |
7(33.33) |
||
| WE | - |
7 |
7(33.33) |
- |
- |
- |
7(33.33) |
||
9 |
MSL | - |
- |
- |
2 |
- |
2(16.66) |
2(8.70) |
|
| FP | 11 |
- |
11(100) |
5 |
- |
5(41.66) |
16(69.56) |
||
| DP | - |
- |
- |
5 |
- |
5(41.66) |
5(21.74) |
||
10 |
GC | - |
- |
- |
1 |
- |
1 |
1(4.76) |
|
| WE | 19 |
- |
19(95) |
- |
- |
- |
19(90.48) |
||
| R | 1 |
- |
1(5) |
- |
- |
- |
1(4.76) |
||
11 |
DP | - |
6 |
6(37.50) |
- |
1 |
1 |
7(36.84) |
|
| WE | - |
1 |
1(6.25) |
- |
- |
- |
1(5.26) |
||
| GT | - |
4 |
4(25) |
1 |
- |
1 |
5(26.31) |
||
| R | 1 |
4 |
5(31.25) |
- |
1 |
1 |
6(31.58) |
||
12 |
No Solution/Missing Solution | - |
- |
- |
- |
- |
- |
0 |
|
When Table 10 was analyzed in general, it was understood that the assistive strategies most used by preservice mathematics teachers at the second-grade level were drawing a picture, making a systematic list and writing equations, while the general strategies were finding patterns, reasoning, and generating-testing.
Most of the preservice teachers who were not able to find the correct answer to this problem (the third problem about playing cards) misjudged by establishing a relationship between the number of floors and the number of cards and could not reach the correct answer. The example of S212 in Figure 15 indicated this situation.
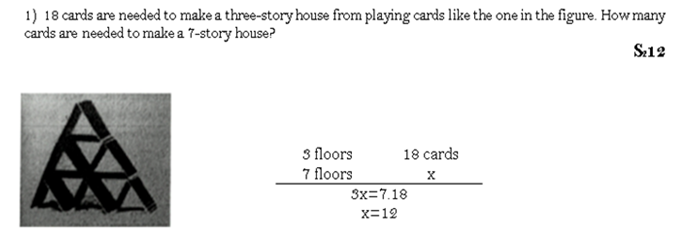
Figure-15. The strategy and incorrect answer of S212 regarding the problem about playing cards. |
The preservice teachers had difficulty in finding the answer to the sixth problem on which they could not develop more than one solution. Nearly 73% of the preservice teachers were not able to answer this problem correctly, or they left it unanswered. The two strategies used by the ones giving correct answers were reasoning (50%) and making a systematic list (50%). 9 preservice teachers (27.27%) proposed single solution by employing these strategies together. Additionally, S230 found the correct answer to this problem by using the strategies of reasoning and making a systematic list together. The strategies and the single solution used to solve this problem by S230 were given as an example in Figure 16.
Table-11 . The strategies used to solve non-routine mathematical problems by the preservice mathematics teachers at the first Grade level, related frequencies and percentage distributions. |
Item No |
Codes | Categories | NSPOS (f) |
Ʃf (%) |
NSPMTOS (f) |
Ʃf (%) |
Overall Ʃf (%) |
||
Single Strategy |
More than One Strategy |
Single Strategy |
More than One Strategy |
||||||
1 |
MSL | 12 |
12 |
24(46.15) |
4 |
1 |
5(33.33) |
29(43.28) |
|
| DP | - |
7 |
7(13.46) |
- |
2 |
2(13.33) |
9(13.43) |
||
| R | 6 |
14 |
20(38.46) |
5 |
2 |
7(46.66) |
27(40.30) |
||
| GC | 1 |
- |
1(1.92) |
1 |
- |
1(6.66) |
2(2.99) |
||
2 |
DP | 6 |
6 |
12(32.43) |
- |
- |
- |
12(33.33) |
|
| MSL | 1 |
- |
1(2.70) |
- |
- |
- |
1(2.78) |
||
| GT | 4 |
1 |
5(13.51) |
- |
- |
- |
5(13.89) |
||
| R | 6 |
5 |
11(29.73) |
- |
- |
- |
11(30.55) |
||
| WE | 6 |
1 |
7(18.91) |
- |
- |
- |
7(19.44) |
||
3 |
DP | 3 |
- |
3(9.68) |
8 |
- |
8(47.05) |
11(22.91) |
|
| FP | 27 |
- |
27(87.09) |
7 |
- |
7(41.17) |
34(70.83) |
||
| GT | 1 |
- |
1(3.22) |
2 |
- |
2(11.76) |
3(6.25) |
||
4 |
MSL | 5 |
- |
5(71.42) |
2 |
- |
2(50) |
7(63.63) |
|
| GC | - |
- |
- |
- |
1 |
1(25) |
1(9.09) |
||
| GT | 2 |
- |
2(28.57) |
- |
1 |
1(25) |
3(27.27) |
||
5 |
FP | 20 |
1 |
21(95.45) |
- |
- |
- |
21(95.45) |
|
| R | - |
1 |
1(4.54) |
- |
- |
- |
1(4.54) |
||
6 |
SP | - |
1 |
1(7.43) |
- |
- |
- |
1(7.43) |
|
| WMS | - |
1 |
1(7.43) |
- |
- |
- |
1(7.43) |
||
| R | 7 |
2 |
9(81.81) |
- |
- |
- |
9(81.81) |
||
7 |
MSL | 10 |
- |
10(100) |
- |
- |
- |
10(100) |
|
8 |
FP | - |
16 |
16(33.33) |
- |
- |
- |
16(33.33) |
|
| GT | - |
16 |
16(33.33) |
- |
- |
- |
16(33.33) |
||
| WE | - |
16 |
16(33.33) |
- |
- |
- |
16(33.33) |
||
9 |
MT | 2 |
- |
2(4.88) |
- |
- |
- |
2(4.16) |
|
| FP | 36 |
- |
36(87.80) |
3 |
- |
3(50) |
39(81.25) |
||
| DP | 3 |
- |
3(7.31) |
3 |
- |
3(50) |
6(12.25) |
||
10 |
GC | 3 |
- |
3(7.31) |
- |
- |
- |
3(7.31) |
|
| WE | 38 |
- |
38(92.69) |
- |
- |
- |
38(92.69) |
||
11 |
DP | - |
35 |
35(48.61) |
- |
- |
- |
35(48.61) |
|
| WE | - |
5 |
5(6.95) |
- |
- |
- |
5(6.95) |
||
| GC | - |
5 |
5(6.95) |
- |
- |
- |
5(6.95) |
||
| R | - |
27 |
27(37.50) |
- |
- |
- |
27(37.50) |
||
12 |
MSL | - |
7 |
7(24.13) |
- |
- |
- |
7(24.13) |
|
| DP | - |
9 |
9(31.03) |
- |
- |
- |
9(31.03) |
||
| WE | - |
9 |
9(31.03) |
- |
- |
- |
9(31.03) |
||
| GT | - |
2 |
2(6.90) |
- |
- |
- |
2(6.90) |
||
| R | - |
2 |
2(6.90) |
- |
- |
- |
2(6.90) |
||
It was understood from Table 11 that the most-used strategies by the preservice teachers were finding patterns, writing equations, reasoning, drawing a picture, making a systematic list, and generating-testing. Merely 8 preservice teachers (16.66%) solved the sixth problem that was about census takers correctly. The preservice teachers who solved this problem correctly mostly employed the strategy of reasoning (81.81%) for this problem, where more than one solution could not be proposed. In the example in Figure 17, the single solution proposed to solve this problem using the strategy of writing mathematical statements and reasoning together by S13 and the solution carried out with the strategy of reasoning by S12 were presented.
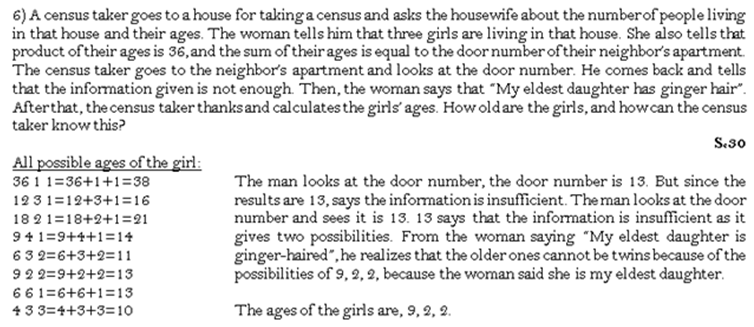
Figure-16. The strategies and correct answer of S230 regarding the problem about census takers.
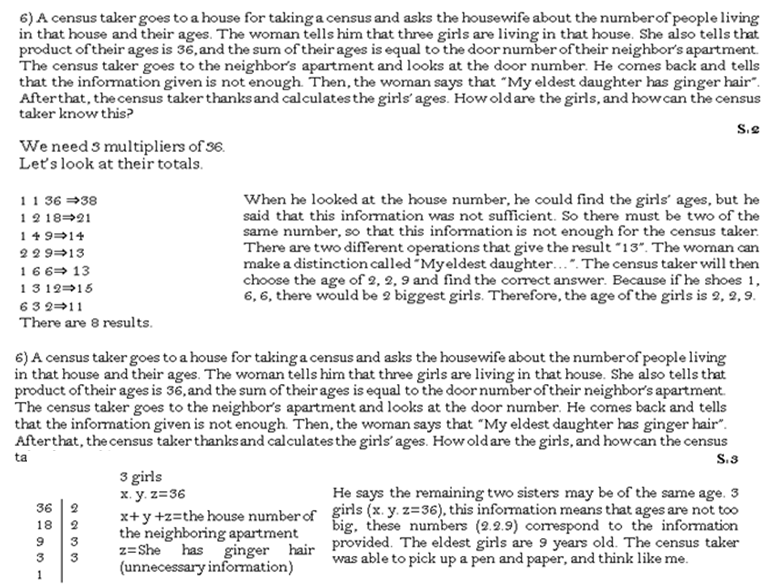
Figure-17. The strategies and answers of S12 and S13 regarding the problem about census takers.
In Table 12, the strategies used most frequently in single or more than single solution to solve non-routine mathematical problems by the preservice secondary school mathematics teachers were analyzed as general and assistive strategies according to grade levels.
According to Table 12, the most-used general strategies were reasoning, guess-check, finding patterns, and generating-testing, while the most-used assistive strategies were making a systematic list, drawing a picture, and writing equations. On the other hand, it was understood from Table 12 that the rate of proposing more than one solution by the preservice teachers at the first and second-grade levels was lower than by the preservice teachers at the third and fourth-grade levels.
According to Table 12 the preservice teachers at the third and fourth-grade levels proposed one or more than one solution by using general and assistive strategies in various combinations for the problems about the perimeter of rectangles, cake, playing cards, frog, palindromic numbers, sequence, bar-pin, masters-apprentices and isosceles triangles more than the other preservice teachers. These teachers employed the strategies of guess-check and generating-testing differently from the preservice teachers at the first and second-grade levels for these problems except for the problem about sequence. On the other hand, the preservice teachers at the first-grade level used the strategies of guess-check, generating-testing, and making a systematic list while the preservice teachers at the second-grade level used only the strategy of making a systematic list for the problem about frogs on which few solutions were proposed. It was understood from Table 12 that the preservice teachers at the second-grade level were inadequate in providing solutions for the non-routine problems compared to the preservice teachers at other grade levels. On the other hand, the preservice teachers at the third-grade level were better in producing solutions and proposing more than one solution for the non-routine problems compared to the ones at the first and second-grade levels. Furthermore, it was concluded from Table 12 that the preservice teachers at the fourth-grade level were better in both finding solutions and employing different strategies compared to the preservice teachers at other grade levels. The data, presented in Table 12, indicated that the preservice teachers at the first-grade level used a greater number of general and assistive strategies in solving non-routine mathematical problems than the ones at the second-grade level, and they proposed more than one solution at the least.
Table-12. Classification of the most-used solution strategies of the preservice secondary school mathematics teachers according to grade levels. |
Item No |
Grade Level |
n(%) |
Ʃn (%) |
The most-used strategies | ||||
C (correct solution) |
IC |
UA |
||||||
Single |
More than one |
General | Assistant | |||||
1 |
1 |
34(70.83) |
8(16.66) |
5(10.41) |
- |
48(100) |
R, GC | DP, MSL |
2 |
20(60.60) |
5(15.15) |
8(24.24) |
- |
33(100) |
R, GC | DP, MSL | |
3 |
26(76.47) |
6(17.64) |
2(5.88) |
- |
34(100) |
R, GC | DP, MSL | |
4 |
26(70.27) |
11(29.73) |
- |
- |
37(100) |
R, GC | DP, MSL | |
2 |
1 |
31(64.58) |
- |
11(22.91) |
5(10.41) |
48(100) |
R | DP, WE |
2 |
14(42.42) |
8(24.24) |
6(18.18) |
5(15.15) |
33(100) |
R, GT | DP | |
3 |
16(47.06) |
11(32.35) |
5(14.70) |
2(5.88) |
34(100) |
R, GC, GT | DP, WE | |
4 |
20(54.05) |
4(10.81) |
12(32.43) |
1(2.70) |
37(100) |
R, GT | DP | |
3 |
1 |
31(64.58) |
9(18.75) |
7(14.58) |
1(2.08) |
48(100) |
FP, GT | DP |
2 |
10(30.30) |
7(21.21) |
14(42.42) |
2(6.06) |
33(100) |
FP | - | |
3 |
12(35.30) |
16(47.05) |
6(17.64) |
- |
34(100) |
R, FP | DP, WE | |
4 |
17(45.94) |
12(32.43) |
8(21.62) |
37(100) |
FP, GT | DP | ||
4 |
1 |
7(14.58) |
2(4.16) |
26(54.16) |
13(27.08) |
48(100) |
GC, GT | MSL |
2 |
1(3.03) |
- |
25(75.75) |
7(21.21) |
33(100) |
- | MSL | |
3 |
2(5.88) |
1(2.94) |
31(91.17) |
- |
34(100) |
R, GT | DP, MSL | |
4 |
11(29.73) |
1(2.70) |
22(59.45) |
3(8.10) |
37(100) |
R, GT | DP, MSL | |
5 |
1 |
21(43.75) |
- |
4(8.33) |
23(47.91) |
48(100) |
FP, R | - |
2 |
11(33.33) |
- |
- |
21(63.63) |
33(100) |
FP | ||
3 |
14(41.17) |
- |
1(2.94) |
19(55.88) |
34(100) |
FP | - | |
4 |
30(81.08) |
- |
4(10.81) |
3(8.11) |
37(100) |
FP | - | |
6 |
1 |
8(16.66) |
- |
8(16.66) |
31(64.58) |
48(100) |
R | - |
2 |
9(27.27) |
- |
2(6.06) |
22(66.66) |
33(100) |
R | MSL | |
3 |
7(20.58) |
- |
20(58.82) |
7(20.58) |
34(100) |
R, GC | - | |
4 |
8(21.62) |
- |
18(48.65) |
11(29.73) |
37(100) |
R, GT | MSL | |
7 |
1 |
10(20.83) |
- |
36(75) |
2(4.16) |
48(100) |
- | MSL |
2 |
7(21.21) |
- |
13(39.39) |
13(39.39) |
33(100) |
GT | MSL | |
3 |
16(47.06) |
1(2.94) |
17(50) |
- |
34(100) |
R | MSL | |
4 |
12(32.43) |
1(2.70) |
23(62.16) |
- |
37(100) |
GC, FP | MSL | |
8 |
1 |
16(33.33) |
- |
16(33.33) |
16(33.33) |
48(100) |
FP, GT | WE |
2 |
7(21.21) |
- |
5(15.15) |
21(63.63) |
33(100) |
FP, GT | WE | |
3 |
17(50) |
- |
11(32.35) |
6(17.65) |
34(100) |
FP, GT | WE | |
4 |
16(43.24) |
- |
12(32.43) |
5(13.51) |
37(100) |
FP, GT | WE | |
9 |
1 |
42(87.50) |
3(6.25) |
2(4.16) |
1(2.08) |
48(100) |
FP | DP |
2 |
12(36.36) |
5(15.15) |
1(3.03 |
15(45.45) |
33(100) |
FP | DP, MSL | |
3 |
26(76.47) |
8(23.53) |
- |
- |
34(100) |
FP | DP | |
4 |
29(78.37) |
4(10.81) |
3(8.10) |
1(2.70) |
37(100) |
FP | DP, MSL | |
10 |
1 |
41(85.41) |
- |
5(10.41) |
2(4.16) |
48(100) |
GC | WE |
2 |
20(60.60) |
1(3.03) |
3(9.09) |
9(27.27) |
33(100) |
R, GC | WE | |
3 |
22(64.70) |
3(8.82) |
8(23.53) |
1(2.94) |
34(100) |
GC, GT | WE | |
4 |
29(78.37) |
6(16.20) |
2(5.40) |
- |
37(100) |
R, GC, GT | WE | |
11 |
1 |
35(72.91) |
- |
11(22.91) |
2(4.16) |
48(100) |
R, GT | DP, WE |
2 |
9(27.27) |
1(3.03) |
10(30.30) |
13(39.39) |
33(100) |
R, GT | DP, WE | |
3 |
24(70.58) |
4(11.76) |
6(17.65) |
- |
34(100) |
R, GT | DP, WE | |
4 |
28(75.67) |
2(5.40) |
7(18.91) |
- |
37(100) |
R, GC, GT | DP, WE | |
12 |
1 |
9(18.75) |
- |
32(66.66) |
7(14.58) |
48(100) |
R, GT | DP, WE |
2 |
- |
- |
24(72.72) |
9(27.27) |
33(100) |
- | - | |
3 |
6(17.65) |
- |
21(61.76) |
7(20.59) |
34(100) |
R, GC, GT | DP, MSL | |
4 |
12(32.43) |
- |
18(48.64) |
1(2.70) |
37(100) |
GC, GT | DP | |
Note: C: Number of preservice teachers giving the correct answer, UA: Number of preservice teachers who left the relevant problem unanswered, IC: Number of preservice teachers giving incorrect answer -: no data in the relevant category, n: number of preservice teachers at the relevant category, Ʃn: Number of preservice teachers at each grade level. |
3.3. Findings Related to the Third Sub-Problem
The findings related to the third sub-problem about the research “What is the number of strategies used for solving non-routine mathematical problems by preservice secondary school mathematics teachers according to grade levels?” were presented in Table 13 and Table 14. The frequencies of the strategies used by the preservice teachers according to grade levels were given in Table 13. On the other hand, the frequencies and percentage distributions of the most-used strategies by the preservice secondary school mathematics teachers for solving non-routine mathematical problems according to grade levels and their ratio by the number of preservice teachers at each grade level were given in Table 14. With the data presented in Table 13 and Table 14, it was aimed to thoroughly analyze the strategies used by the preservice teachers while solving non-routine problems according to grade levels. In this context, Table 13 and Table 14 were created concerning the data in the tables generated for the analysis of the second sub-problem.
Table-13. Frequencies of the most-used strategies for solving non-routine mathematical problems by the preservice secondary school mathematics teachers according to grade levels and the ratio of the number of strategies used to the number of preservice teachers at different grade levels. |
| Strategies Used | Grade Levels |
Ʃf |
Ʃf/(n1+n2) |
Grade Levels |
Ʃf |
Ʃf/(n3+n4) |
||||||||
1 |
2 |
3 |
4 |
|||||||||||
n1:48 |
n2:33 |
n3:34 |
n4:37 |
|||||||||||
| Making a systematic list | 54 |
32 |
86 |
1.06 |
35 |
53 |
88 |
1.24 |
||||||
| Drawing a picture | 73 |
43 |
116 |
1.43 |
112 |
127 |
239 |
3.36 |
||||||
| Writing equations | 75 |
27 |
102 |
1.26 |
37 |
75 |
112 |
1.58 |
||||||
| Writing mathematical statements | 1 |
- |
1 |
0.01 |
- |
1 |
1 |
0.01 |
||||||
| Simplifying the problem | 1 |
- |
1 |
0.01 |
2 |
1 |
3 |
0.04 |
||||||
| Making table | 1 |
- |
1 |
0.01 |
3 |
2 |
5 |
0.07 |
||||||
| Guess-Check | 6 |
4 |
10 |
0.12 |
42 |
5 |
47 |
0.66 |
||||||
| Reasoning | 77 |
36 |
113 |
1.40 |
90 |
77 |
167 |
2.35 |
||||||
| Generating-testing | 37 |
31 |
68 |
0.84 |
40 |
34 |
74 |
1.04 |
||||||
| Finding patterns | 110 |
50 |
160 |
1.98 |
84 |
110 |
194 |
2.73 |
||||||
Note: no data in the relevant category, n: number of preservice teachers at each grade level, |
The data in Table 13 indicated that the number of strategies used by the preservice teachers at the third and fourth-grade levels was higher than the number of strategies used by the ones at the first and second-grade levels. While the third and fourth-grade levels employed mostly the strategies of drawing a picture, finding patterns, reasoning, writing equations, and making a systematic list, the first and second-grade levels used mostly the strategies of finding patterns, drawing a picture, reasoning, and writing equations. It was also concluded from Table 13 that the strategies of writing mathematical statements, simplifying the problem, making tables, guess-check, and generating-testing were not adequately used by the preservice teachers at each grade level.
Table-14. Total number and percentage distributions of the strategies used by the preservice teachers proposing single and more than single solution and their ratio by the number of preservice teachers at each grade level. |
Grade Levels |
Number of Preservice Teachers |
Total number and percentage distributions of the strategies used by the preservice teachers proposing single solution and their ratio by the number of preservice teachers at each grade level |
Total number and percentage distributions of the strategies used by the preservice teachers proposing more than single solution and their ratio by the number of preservice teachers at each grade level |
Overall total number of strategies and percentages and their ratio by the number of preservice teachers at each grade level |
|||||||
n |
Ʃf |
% |
Ʃf/n |
Ʃf |
% |
Ʃf/n |
Ʃf |
% |
Ʃf/n |
||
4 |
37 |
433 |
81.09 |
11.70 |
101 |
18.91 |
2.73 |
534 |
100 |
14.43 |
|
3 |
34 |
311 |
69.89 |
9.14 |
134 |
30.11 |
3.94 |
445 |
100 |
13.08 |
|
2 |
33 |
176 |
74.27 |
5.33 |
61 |
23.73 |
1.84 |
237 |
100 |
7.18 |
|
1 |
48 |
399 |
90.48 |
8.31 |
42 |
9.52 |
0.88 |
441 |
100 |
9.19 |
|
Total number and percentage distributions of the strategies used by the preservice teachers proposing single and more than single solution according to grade levels and the ratio of the total number of strategies to the number of preservice teachers at each grade level were presented in Table 14. The reason for determining the ratio of the total number of strategies used to the number of preservice teachers at each grade level was that the number of preservice teachers at each grade level was different. Thus, it became possible to interpret more clearly by comparing the ratio of the number of strategies used at each grade level. According to Table 14, the greatest number of strategies was used by the preservice teachers at the fourth grade level at the rate of 14.43 while the least number of strategies was employed by the ones at the second grade level at the rate of 7.18. When the rate of preservice teachers proposing single solution was analyzed, it was seen that the greatest number of strategies was used by the preservice teachers at the fourth grade level at the rate of 11.70, and the least number of strategies was employed by the ones at the second grade level at the rate of 5.33. On the other hand, the rate of preservice teachers proposing more than single solution indicated that the greatest number of strategies was employed by the preservice teachers at the third grade level at the rate of 3.94, while the least number of strategies was used by the preservice teachers at the first grade level at the rate of 0.88. In this context, it was understood from Table 14 that the rate of preservice teachers proposing more than single solution was far less than the rate of preservice teachers proposing single solution at each grade level. Thus, it can be claimed that the preservice teachers at any grade levels were not able to propose two, three, or more solutions for solving non-routine mathematical problems. Table 14 also indicated that the number of preservice teachers proposing more than single solution by using different problem-solving strategies and its ratio to the total number of strategies used was quite low. The number of strategies used by the preservice teachers at the third and fourth-grade levels was relatively more than the number of strategies used by the ones at the first and second-grade levels in solving problems.
4. Conclusion, Discussion, and Implication
4.1. Analysis of the Number of Solutions Proposed by the Preservice Secondary School Mathematics Teachers for Non-routine Mathematical Problems
It was understood from the findings related to the number of different ways of solving non-routine mathematical problems by the preservice secondary school mathematics teachers that the preservice teachers at any grade levels were generally able to solve the problems in a single way, and more than half of them had difficulty in finding solutions for the problems. While nearly half of the preservice teachers proposed single solution, few preservice teachers were able to propose three solutions. Particularly, the preservice teachers at the first and second-grade levels could not propose any solutions for the fourth and twelfth problems, and only a few preservice teachers answered the third, fifth, sixth, and twelfth problems. The preservice teachers at the third and fourth-grade levels proposed a greater number of second and third solutions for the problems compared to the other preservice teachers. The preservice teachers at any grade levels were not able to propose more than three solutions. Thus, it can be stated that the preservice teachers generally had difficulty in proposing more than one solution. Bayrakdar, Deniz, Akgün, and Isleyen (2011) expressed in their study in which real-life problems prepared for high school students in PISA 2003 were asked to the preservice primary school mathematics teachers that the preservice teachers had difficulty in solving the problems and their knowledge of problem-solving strategies was inadequate. Therefore, this study was similar to the conclusion of the study conducted by Bayrakdar et al. (2011) with regards to having difficulty in solving non-routine mathematical problems. Gürbüz and Güden (2016) concluded in their study which was conducted on secondary school mathematics teachers that the teachers were partially competent in finding the correct answers of the problems, but they were not competent in using different strategies. Therefore, it can be expressed that the results of this study showed similarity with the results of the study carried out by Gürbüz and Güden (2016). The research carried out by Türker-Biber et al. (2017) was significant since it showed inconsistency between theoretical knowledge of the primary school mathematics teachers and their practices. Türker-Biber et al. (2017) emphasized in every phase of classes that problem solving should be process-based rather than outcome-based and that including different solutions in the problem-solving process is important for making students think on different solutions; however, they could not reflect this into their teaching. The common feature of the results of this study and the study carried out by Türker-Biber et al. (2017) was that the preservice teachers were aware of the importance of more than one solution, but they were not capable of applying this in practice. These two studies are similar from this aspect.
The solution of non-routine problems requires various mental skills such as determining the relationship between the data, analyzing and synthesizing, thinking abstractly, and identifying problem situations (Altun, 2014). The results of this study revealed this situation. This is because of the fact that the preservice secondary school mathematics teachers were mostly not able to solve non-routine mathematical problems, especially the 4th, 6th, and 12th problems since they could not reason and identify problem situations. If it is considered that employing strategies such as judgment and guess-check which provide reasoning in proposing more than one solution for a non-routine problem is significant, it can be interpreted that the preservice teachers at the first and second-grade levels showed a routine approach to solve the problems as they used only the strategies of drawing a picture and making a systematic list. On the other hand, the fact that the preservice teachers at the fourth-grade level proposed more than one solution for these problems and used general and assistive strategies together can be interpreted as an indicator showing that they gained a different point of view for solving non-routine problems.
The preservice teachers’ having sufficient knowledge of problem-solving strategies and practices is a necessity for the completion of a smooth problem-solving process. However, knowing strategies and practices may not be sufficient for effective mathematics teaching. This is because of the fact that students’ showing different approaches to the problems and making them feel that a problem has more than one solution can be provided by all kinds of mental activities and practices. Problem-solving processes and mathematical thinking are closely related. Because Henderson et al. (2002) defined mathematical thinking as “using mathematical techniques, concepts, and methods in the problem-solving process directly or indirectly”. Therefore, mathematical thinking skills of the students can be improved through activities carried out in problem-solving process such as dealing with a problem, thinking and designing the solution (Hacısalihoğlu, Mirasyedioğlu, & Akpınar, 2003). Problem-solving underlies mathematical thinking as it provides students the opportunity to use mathematical strategies such as abstraction, expression, symbolization, generalization, proving, and suggesting new questions (Arslan & Yıldız, 2010). Therefore, the preservice teachers should be able to comprehend the importance of problem-solving and provide learning environments appropriate for alternative solutions (Baki, 2014). It was also seen in this study that the preservice secondary school mathematics teachers were mostly insufficient to propose more than one solution to a non-routine problem. Therefore, the preservice mathematics teachers can be advised to highlight the importance of problem-solving, to analyze problem-solving strategies thoroughly and to study on real-life-related non-routine mathematics problems and problem-solving strategies.
4.2. Analysis of the Most-Used Strategies for Solving Non-routine Mathematical Problems by the Preservice Secondary School Mathematics Teachers
It was revealed that the most-used strategies for solving non-routine mathematical problems by the preservice secondary school mathematics teachers were the general strategies of reasoning, guess-check, finding patterns and generating-testing, and the assistive strategies of making a systematic list, drawing a picture and writing equations. On the other hand, the assistive strategies of making tables, simplifying the problem, and writing mathematical statements were slightly used by the preservice teachers. For instance, the sixth problem which was about census takers was not answered by most of the preservice teachers. The preservice teachers were not able to reason appropriately since they could not relate the information given with the things asked. When the answers of the preservice teachers who were not able to propose any correct solutions for this problem were analyzed, it was seen that they did not employ the general strategies of reasoning, guess-check, and generating-testing. And, when the answers of the preservice teachers who solved this problem correctly were analyzed, it was seen that all of them used the strategy of reasoning. The preservice teachers proposing solutions for this problem examined the problem thoroughly, justified their ideas by making predictions, and expressed their solutions. As these are the characteristics of the individuals who can do reasoning, it can be suggested to provide appropriate learning environments for the preservice teachers, as the reasoning ability can be improved by education (Umay, 2003). On the other hand, it was understood that the preservice teachers who did not use general strategies such as reasoning in solving non-routine mathematical problems, who tried to solve only with assistive strategies, could not find the correct solution. For instance, the preservice teachers were not able to solve the problem of palindromic numbers correctly because they could not develop logical reasoning for the solution of the problems. Saygılı (2017) stated in his study that high school students were able to solve the problems by using at least two or three strategies. It was also stated in this study that the most-used strategies by the high school students were the strategies of making a systematic list, finding patterns, logical reasoning, and drawing a picture. The results of the study conducted by Saygılı (2017) and of this study were similar to each other in the context of general strategies used. This result indicated that organizing the data, classifying them, seeing the relationship between the data, using different problem-solving strategies, and applying accurate and systematic reasoning are important (Altun, 2014; Mahlios, 1988; Mayer et al., 1995). Choosing suitable strategies for solving the problems during the process of problem-solving and implementing the strategies chosen are among the basic phases of problem-solving. If students are expected to develop problem-solving skills, they should be taught the problem-solving strategies actively (Fülöp, 2015). For this reason, the preservice teachers need to know the problem-solving process and problem-solving strategies. The preservice teachers having insufficient pedagogical content knowledge may not be able to carry out strategy teaching, which is a complex process, as required. In this study, the reason for the preservice teachers at the third and fourth-grade levels used strategies a bit more than the ones at the first and second-grade levels and proposed more than one solution might be the fact that they had received the courses of Special Teaching Methods I-II. However, it has been observed that the preservice teachers at the third and fourth-grade levels had difficulty in solving non-routine mathematical problems that require the usage of general strategies such as logical reasoning and generating-testing, and nearly half of them could not propose any solutions. Thus, it can be suggested that teaching problem-solving in mathematics teachers’ training programs should be handled more comprehensively than the current situation.
4.3. Analysis of the Number of Strategies Used by the Preservice Secondary School Mathematics Teachers for the Solution of Non-Routine Mathematical Problems According to Grade Levels
When the number of strategies used by the preservice secondary school mathematics teachers for solving non-routine mathematical problems was examined according to grade levels, it was understood that the greatest number of strategies was used by the preservice teachers at the fourth-grade level while the least number of strategies was used by the ones at the second grade level in general. The ratio of proposing one solution for the problems indicated that the greatest number of strategies was used by the preservice teachers at the fourth-grade level while the least number of strategies was used by the ones at the second-grade level. On the other hand, the ratio of proposing more than one solution indicated that the greatest number of strategies was used by the preservice teachers at the third-grade level while the least number of strategies was used by the ones at the second-grade level. Thus, it can be claimed that the number of strategies used by the preservice teachers at the third and fourth-grade levels in solving problems was higher than the ones at the first and second-grade levels. Although the preservice teachers at the second-grade level were better at proposing more than one solution compared to the ones at the first-grade level, the ratio of the number of strategies used by the ones at the second-grade level (7.18) was lower than by the ones at the first-grade level (9.19). However, when considered generally, it can be said that as the grade level increased, the number of strategies used by the preservice teachers in solving non-routine mathematical problems increased. It can also be said that as the grade level increased between the first, third, and fourth-grade levels, the use of basic strategies such as reasoning, guess-check, generating-testing, and finding patterns and the number of proposing more than one solution increased. With reference to this finding, it can be claimed that the preservice teachers at the third and fourth-grade levels had a relatively deeper approach towards the problems compared to the other preservice teachers. Calışkan et al. (2006) stated that expert problem solvers approach problems more systematically than novice problem solvers, and they use more than one problem-solving strategy, and novice problem solvers try to solve problems with mathematical equations without organizing information and without making a qualitative description of the problem, and they do not benefit from problem-solving strategies sufficiently. Accordingly, it can be expressed that the finding of this study is parallel to that of Calışkan et al. (2006). The probability that the preservice teachers may encounter more non-routine mathematical problems with the increase in the class level may have been effective in the emergence of this result.
The finding that the preservice teachers at the first and second-grade levels used hardly any of the strategies apart from the assistive strategies of drawing a picture and making a systematic list for the fourth problem about frogs and were mostly not able to solve it is worth thinking about. In this study, it was found that the preservice secondary school mathematics teachers mostly were not able to propose alternative solutions for non-routine mathematical problems and use problem-solving strategies properly and adequately. Hence, it can be recommended to organize programs that will enable the preservice teachers to encounter more non-routine problems and to do practices frequently that require the use of problem-solving strategies. Because more important than solving the problem in the solution of such problems are the thoughts and approaches developed in the solution process (Mayer et al., 1995). In conclusion, it can be suggested that the preservice teachers at any grade levels were not competent enough to propose more than one solution for the non-routine mathematical problems and to employ problem-solving strategies.
References
Altun, M. (2014). Teaching mathematics in secondary schools (5th, 6th, 7th and 8th grades). Bursa: Actual Publishing.
Altun, M., & Sezgin-Memnun, D. (2008). Mathematics teacher trainees’ skills and opinions on solving non-routine mathematical problems. Journal of Theory and Practice in Education, 4(2), 213-238.
Arslan, S., & Yıldız, C. (2010). Reflections from the experiences of 11th graders during the stages of mathematical thinking. Education and Science, 35(156), 17-31.
Atteh, E., Andam, E. A., & Obeng-Denteh, W. (2017). Problem solving framework for mathematics discipline. Asian Research Journal of Mathematics, 4(4), 1-11.Available at: https://doi.org/10.9734/arjom/2017/32586.
Aydoğdu, A. (2014). A research on geometry problem solving strategies used by elementary mathematics teacher candidates. Journal of Education and Instructional Studies in The World, 4(1), 53-62.
Baki, A. (2014). Mathematics education from theory to practice. Ankara: Letter Education Publishing.
Ball, D. L., Hill, H. C., & Bass, H. (2005). Knowing mathematics for teaching. Who knows mathematics well enough to teach third grade, and how can we decide? American Educator, 29(1), 14-46.
Ball, L. D., Thames, M. H., & Phelps, G. (2008). Content knowledge for teaching: What makes it special? Journal of Teacher Education, 59(5), 389-407.Available at: https://doi.org/10.1177/0022487108324554.
Bayazit, I. (2013). An investigation of problem solving approaches, strategies, and models used by the 7th and 8th grade students when solving real-world problems. Educational Sciences: Theory and Practice, 13(3), 1920-1927.
Bayazit, İ., & Aksoy, Y. (2010). Learning and teaching of mathematical problems. (E. Bingölbali & M. F. Özmantar (Ed.), In the mathematical difficulties and solution suggestions of primary school students (2nd ed., pp. 287312-287154). Ankara: Pegem Academy Publishing.
Baykul, Y. (2014). Teaching mathematics in secondary school (Grades 5-8). Ankara: Pegem A Yayıncılık.
Bayrakdar, Z., Deniz, D., Akgün, L., & Isleyen, T. (2011). Problem solving approaches of mathematics teacher candidates in PISA 2003. Procedia-Social and Behavioral Sciences, 15, 3334-3337.Available at: https://doi.org/10.1016/j.sbspro.2011.04.295.
Behlol, M. G., Akbar, R. A., & Sehrish, H. (2018). Effectiveness of problem solving method in teaching mathematics at elementary level. Bulletin of Education and Research, 40(1), 231-244.
Cabanilla-Pedro, L. A., Acob-Navales, M., & Josue, F. T. (2014). Improving analyzing skills of primary students using a problem solving strategy. Journal of Science and Mathematics Education in S. E. Asia, 27(1), 33-53.
Calışkan, S., Erol, M., & Selçuk, S. (2006). Evaluation of the problem solving behaviors of physics teacher candidates. Journal of Education Faculty (HU Journal of Education), 30, 73-81.
Creswell, J. W. (2013). Qualitative inquiry and research design choosing among five approaches according to the five approaches. (Trans. M. Tum, and S. B. Demir) (3rd ed.). Ankara: Political Bookstore.
De Hoyos, M., Gray, E., & Simpson, A. (2004). Uncertainty during the early stages of problem solving. Paper presented at the 28th Conference of the International Group for the Psychology of Mathematics Education.
Fedosejeva, J., Boče, A., Romanova, M., Iliško, D., & Ivanova, O. (2018). Education for sustainable development: The choice of pedagogical approaches and methods for the implementation of pedagogical tasks in the Anthropocene age. Journal of Teacher Education for Sustainability, 20(1), 157-179.Available at: https://doi.org/10.2478/jtes-2018-0010.
Follmer, R. (2000). Reading, mathematics and problem solving: The effects of direct instruction in the development of fourth grade students’ strategic reading and problem solving approaches to textbased, non-routine mathematical problems. Unpublished Doctoral Thesis (Ed. D.), University of Widener, Chester PA.
Fülöp, E. (2015). Teaching problem-solving strategies in mathematics. LUMAT (2013–2015 Issues), 3(1), 37-54.
Gürbüz, R., & Güden, Y. (2016). The strategies mathematics teachers use in problem solving. Ahi Evran University Kırşehir Faculty of Education Journal, 17(2), 371-386.
Hacısalihoğlu, H., Mirasyedioğlu, Ş., & Akpınar, A. (2003). Mathematics teaching: Constructivist learning and teaching in mathematics. Ankara: Asil Yayın Dağıtım.
Henderson, P. B., Hitchner, L., Fritz, S. J., Marion, B., Scharff, C., Hamer, J., & Riedesel, C. (2002). Materials development in support of mathematical thinking. ACM SIGCSE Bulletin, 35(2), 185-190.Available at: https://doi.org/10.1145/782941.783001.
Ipek, A. S., & Okumus, S. (2012). The representations of pre-service elementary mathematics teachers used in solving mathematical problems. Gaziantep University Journal of Social Sciences, 11(3), 681-700.
Ishida, J. (2002). Students’ evaluation of their strategies when they find several solution methods. The Journal of Mathematical Behavior, 21(1), 49-56.Available at: https://doi.org/10.1016/s0732-3123(02)00102-5.
Karataş, İ., & Güven, B. (2003). Methods used to evaluate problem solving behaviors: Potential of clinical interview. Elementary Education Online, 2(2), 2-9.
Kılıç, Ç. (2017). A new problem-posing approach based on problem solving strategy: Analyzing pre-service primary school teachers’ performance. Educational Sciences: Theory & Practice, 17(3), 771–789.
LeBlanc, J. F. (1977). You can teach problem solving. Arithmetic Teacher, 25(2), 16-20.
Mahlios, J. (1988). Word problems: Do i add or subtract? The Arithmetic Teacher, 36(3), 48-52.
Mayer, R. E., Sims, V., & Tajika, H. (1995). A comparison of how textbooks teaching mathematical problem solving in Japan and the United States. American Educational Research Journal, 32(2), 443-459.Available at: https://doi.org/10.2307/1163438.
Merriam, S. B. (2013). Qualitative research a guide to desing and implementation (Translated by S. Turan.) (3rd ed.). Ankara: Nobel Academic Publishing.
Miles, M. B., & Huberman, A. M. (1994). Qualitative data analysis: An expanded sourcebook (2nd ed.). California: SAGE Publications.
Miller, C. M. (2000). Student-researched problem solving strategies. Mathematics Teacher, 93(2), 136-138.
Nafees, M. (2011). An experimental study on the effectiveness of problem-based versus lecture-based instructional strategy on achievement, retention and problem solving capabilities in secondary school general science students. PhD Unpublished Thesis. International Islamic University, Islamabad.
National Council of Teachers of Mathematics (NCTM). (2000). Principles and standards for school mathematics. Reston: VA.
Ortiz, E. (2016). The problem solving process in a mathematics classroom. Transformations, 1(1), 4-13.
Polya, G. (1957). How to solve ıt: A new aspect of mathematical method. New Jersey: Princeton University Press.
Polya, G. (1973). How to solve it. Princeton, USA: Princeton University Press.
Posamentier, A. S., & Krulik, S. (1998). Problem solving strategies for efficient and elegant solutions – a resource for the mathematics teacher. California: Sage Publications Ltd.
Posamentier, A. S., & Krulik, S. (2008). Problem solving strategies for efficient and elegant solutions, grades 6-12: A resource for the mathematics teacher. USA: Corwin Press.
Posamentier, A. S., & Krulik, S. (2009). Problem solving in mathematics, grades 3-6: Powerful strategies to deepen understanding. USA: Corwin Press.
Saygılı, S. (2017). Examining the problem solving skills and the strategies used by high school students in solving non-routine problems. E-International Journal of Educational Research, 8(2), 91-114.
Shulman, L. S. (1986). Those who understand: Knowledge growth in teaching. Educational Researcher, 15(2), 4-14.Available at: https://doi.org/10.3102/0013189x015002004.
Taspinar, Z., & Bulut, M. (2012). Determining of problem solving strategies used by primary 8 grade students’ in mathematics class. Procedia-Social and Behavioral Sciences, 46, 3385-3389.Available at: https://doi.org/10.1016/j.sbspro.2012.06.071.
Türker-Biber, B., Aylar, E., Ay, Z. S., & Akkuş-İspir, O. (2017). Pre-service primary school mathematics teachers’ pedagogical content knowledge of problem-solving through interviews and in-class practice observations. Kastamonu Education Journal, 25(4), 1483-1498.
Umay, A. (2003). Mathematical reasoning ability. Hacettepe University Journal of Education, 24(24), 234-243.
Weber, K. (2008). How mathematicians determine if an argument is a valid proof. Journal for Research in Mathematics Education, 39(4), 431-459.
Wickelgren, W. A. (1974). How to solve problems. USA: Freeman Publication.
Yavuz, G. (2006). The effect of teaching problem-solving strategy on affective domains and achievement level in the 9th class mathematics course. Unpublished Doctoral Dissertation. Dokuz Eylul University Institute of Educational Sciences, İzmir.
Yazgan, Y. (2007). Fourth and fifth-grade students’ levels of using problem-solving strategies: A teaching experiment. Elementary Education Online, 6(2), 249-263.
Yazgan, Y., & Arslan, C. (2017). Mathematical extraordinary problem solving strategies and examples (4th ed.). Ankara: Pegem Academy.
Asian Online Journal Publishing Group is not responsible or answerable for any loss, damage or liability, etc. caused in relation to/arising out of the use of the content. Any queries should be directed to the corresponding author of the article. |